Figure 2.

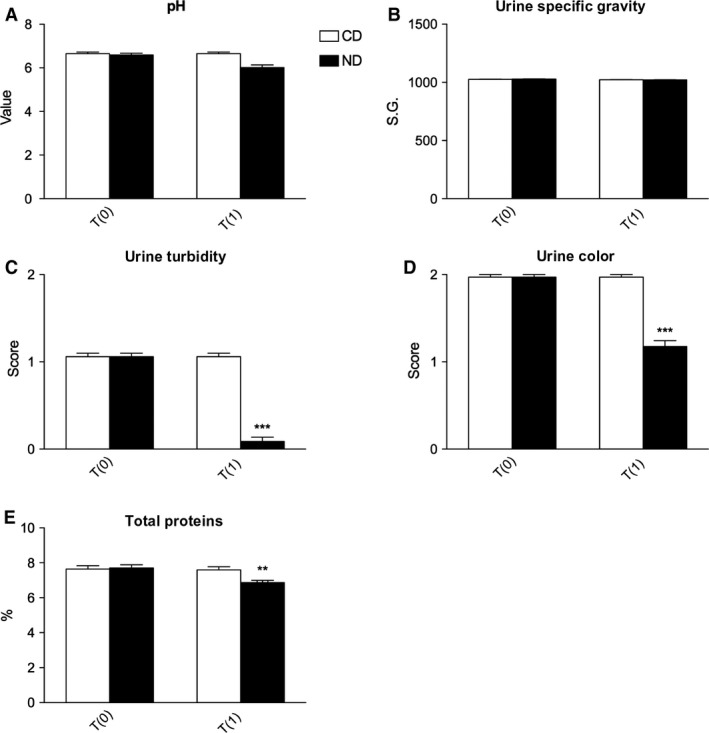
Changes in urine parameters in cats affected by CKD and treated with control diet (CD) or nutraceutical diet (ND) before (T0) and after 90 days (T1) of diet administration. **P < 0.01 versus CD and ***P < 0.001 versus CD

Changes in urine parameters in cats affected by CKD and treated with control diet (CD) or nutraceutical diet (ND) before (T0) and after 90 days (T1) of diet administration. **P < 0.01 versus CD and ***P < 0.001 versus CD