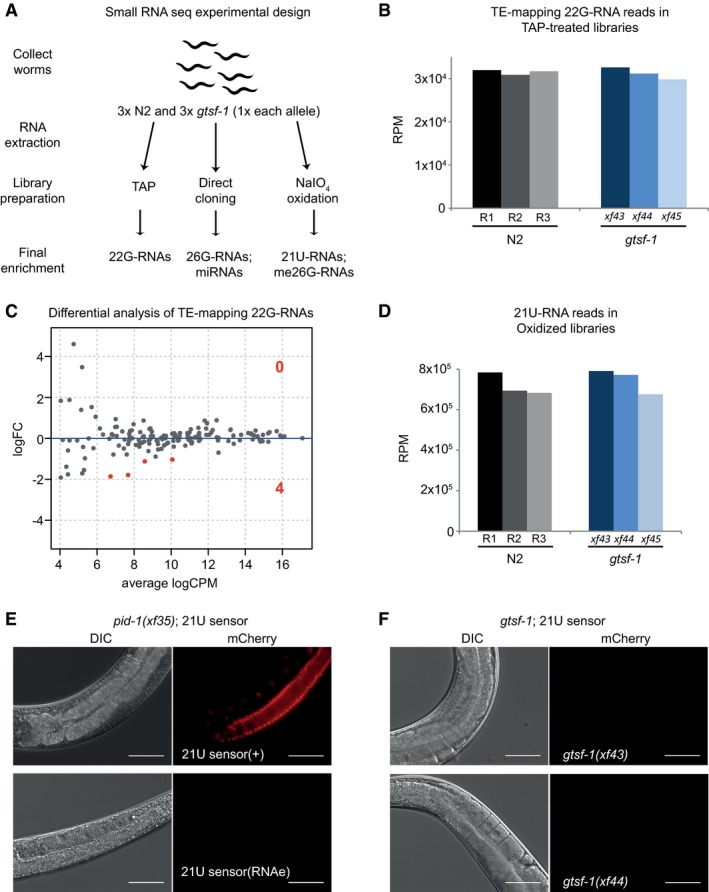
Figure 2. Caenorhabditis elegans GTSF‐1 is not involved in the 21U‐RNA pathway and TE silencing.

-
AExperimental design of sRNA sequencing. Wild‐type and gtsf‐1 mutant gravid adult worms were collected in triplicates. For gtsf‐1, one sample of each allele was used as a biological replicate. Libraries were subjected to a triad of treatments to enrich for different sRNA species. TAP, tobacco acid pyrophosphatase.
-
BSimilar abundance of TE‐mapping 22G‐RNA reads in TAP‐treated libraries in wild‐type (N2) and gtsf‐1 mutants (Welch two sample t‐tests P‐value = 0.75). Normalized levels in reads per million (RPM) for each biological replicate are shown.
-
CDifferential analysis (MA‐plot) of TE‐mapping 22G‐RNAs in gtsf‐1 mutants versus wild‐type. sRNA reads from TAP‐treated libraries were used for this analysis. Only four TEs show significantly downregulated (1% FDR) sRNA levels in gtsf‐1 mutants (see Table EV1). LogFC, Log2 fold change. logCPM, log2 counts per million.
-
DSimilar abundance of 21U‐RNA reads in oxidized libraries in wild‐type (N2) and gtsf‐1 mutants (Welch two sample t‐tests P‐value = 0.62). Normalized levels in reads per million (RPM) for each biological replicate are shown.
-
E, FTesting the participation of gtsf‐1 in the 21U‐RNA pathway. For each figure, left panels are DIC, while right panels show mCherry fluorescence channel. (E) Photomicrographs of adult worms carrying a 21U‐RNA reporter in the pid‐1(xf35) background. The panels above show a strain in which the 21U‐sensor is still dependent on the 21U‐RNA pathway, because in the absence of PID‐1, mCherry can be observed in the germline. The panels below show a strain in which reporter silencing became independent of the 21U‐RNA pathway, a state known as RNAe. (F) Micrographs of 21U‐sensor;gtsf‐1 worms exhibiting the sensor repressed. This images are representative of 21U‐sensor;gtsf‐1 worms originating from the crosses with both strains shown in (E) (schematics of the crosses are shown in Fig EV2F and G). Scale bars represent 50 μm.
