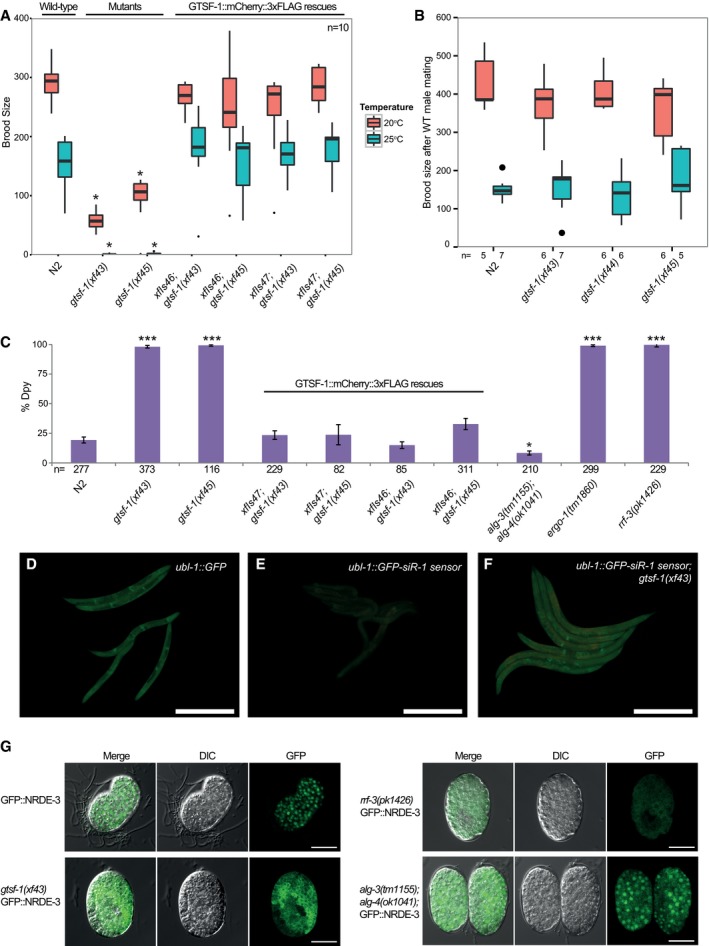
Figure 3. gtsf‐1 animals phenocopy 26G‐RNA pathway mutants.

-
ABoxplot of brood size counts at 20 and 25°C. The progenies of 10 worms were counted for each strain and each temperature. Asterisks indicate P‐value < 0.0002 as assessed by Mann–Whitney and Wilcoxon tests comparing N2 worms with the other strains. Comparisons were done for each respective temperature. Horizontal lines represent the median, the bottom and top of the box represent the 25th and 75th percentile. Whiskers include data points that are less than 1.5 × IQR away from the 25th and 75th percentile.
-
BHermaphrodites with the genotypes indicated on the x‐axis were mated with wild‐type males, and the progeny was counted. n for each condition is indicated in the figure below the x‐axis. Mann–Whitney and Wilcoxon tests yielded P‐values > 0.4. Horizontal lines represent the median, the bottom and top of the box represent the 25th and 75th percentile. Whiskers include data points that are less than 1.5 × IQR away from the 25th and 75th percentile.
-
CAssaying sensitivity to somatic dpy‐13 RNAi. The rescuing transgenes shown in (A) are also assayed here. Total number of worms assayed is represented in the figure. Mann–Whitney and Wilcoxon tests were used to test whether penetrance of dpy‐13 RNAi treatment was significantly different between N2 and mutant worms. Single asterisk indicates P‐value = 0.027, while triple asterisks indicate P‐values < 2.3e‐05, P‐values calculated using Mann–Whitney and Wilcoxon tests. Error bars represent the SEM.
-
D–FGFP fluorescence images of worms carrying 22G‐siR‐1 sensor transgenes (see also Fig EV3G). Scale bars represent 0.5 mm. (D) Animals carrying the control transgene with no 22G‐siR‐1 binding site. (E) Strains carrying the 22G‐siR‐1 sensor. (F) GFP signal in the absence of GTSF‐1.
-
GMicrographs of GFP::NRDE‐3 embryos in various genetic backgrounds. Scale bars represent 10 μm.
