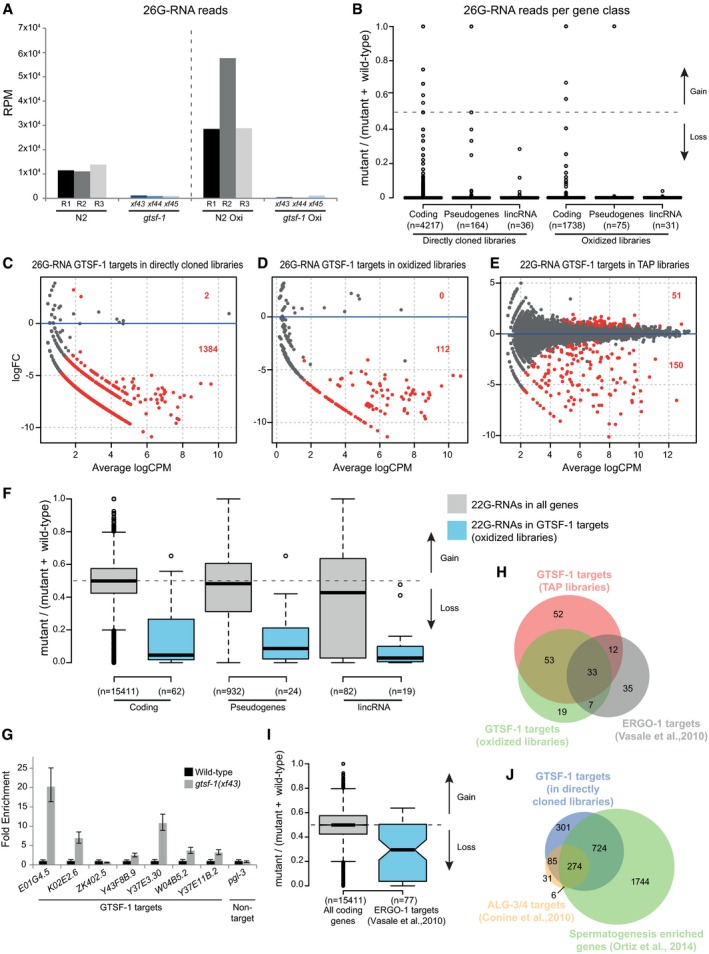
Figure 4. 26G‐RNAs are severely depleted in gtsf‐1 mutants.

-
AGlobal levels of 26G‐RNAs in wild‐type and gtsf‐1 mutant worms, in RPM (reads per million). Three biological replicates are shown, represented as R1–R3 for wild‐type N2 worms. The dashed line separates the levels of 26G‐RNAs in different library treatments: directly cloned libraries on the left, and oxidized libraries on the right.
-
BBoxplot showing enrichment/depletion of normalized 26G‐RNA reads per gene in gtsf‐1 mutants relative to wild type, separated by gene class. All the genes in each class that had 26G‐RNA mapped reads were used for this analysis.
-
C–EIdentification of GTSF‐1 target genes that are significantly depleted of 26G‐ or 22G‐RNA reads in the mutants in comparison with wild type. Separate MA plots are shown for the different library treatments. Statistically significant changes (1% FDR) are highlighted in red, and their number is indicated. LogFC, log2 fold change. LogCPM, log2 counts per million.
-
FBoxplot showing enrichment/depletion of 22G‐RNA reads in gtsf‐1 mutant in TAP libraries, by gene class, using all genes with mapped 22G‐RNAs (gray boxes), and only 22G‐RNAs that map to GTSF‐1 targets (blue boxes), as defined in the oxidized libraries (D). Horizontal lines represent the median, the bottom and top of the box represent the 25th and 75th percentile. Whiskers include data points that are less than 1.5 × IQR away from the 25th and 75th percentile.
-
GRT–qPCR of seven GTSF‐1 targets and a non‐target (pgl‐3). Error bars represent the standard deviation of two biological replicates. pmp‐3 was used as the normalizing gene.
-
HVenn diagram showing overlap of targets of the indicated libraries with previously defined ERGO‐1 targets (Vasale et al, 2010).
-
IBoxplot indicating enrichment/depletion of 22G‐RNA levels (from the TAP‐treated libraries) in all coding genes (gray box), and in ERGO‐1 targets as defined by others. We used only 77/87 ERGO‐1 RIP targets from Vasale et al, 2010, since for the remaining 10 targets, we did not have mapped reads. Horizontal lines represent the median, the bottom and top of the box represent the 25th and 75th percentile. Whiskers include data points that are less than 1.5 × IQR away from the 25th and 75th percentile. Notches represent the 95% confidence interval for each median.
- J
