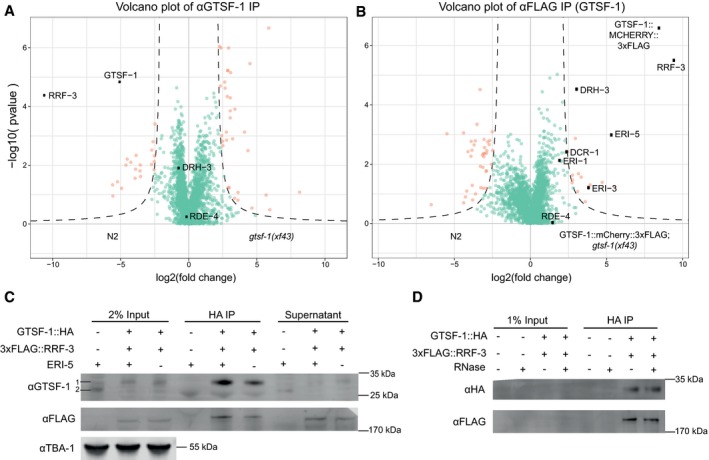
Volcano plots representing label‐free proteomic quantification of GTSF‐1 IPs from adult worm extracts. For each strain, IPs were performed and measured in quadruplicates. Log
2 fold enrichment of individual proteins in one strain versus another is given on the
x‐axis. The
y‐axis indicates the Log
10‐transformed probability of the observed enrichments (see
Materials and Methods for details). Proteins in the background are represented as green dots, while orange dots show enriched proteins. In (A), GTSF‐1 was immunoprecipitated using our polyclonal anti‐GTSF‐1 antibody (in wild‐type and
gtsf‐1 mutant worms), while in (B), an anti‐FLAG antibody was used to pull‐down GTSF‐1::mCherry::3xFLAG (in wild‐type and strains carrying the rescuing transgene).

