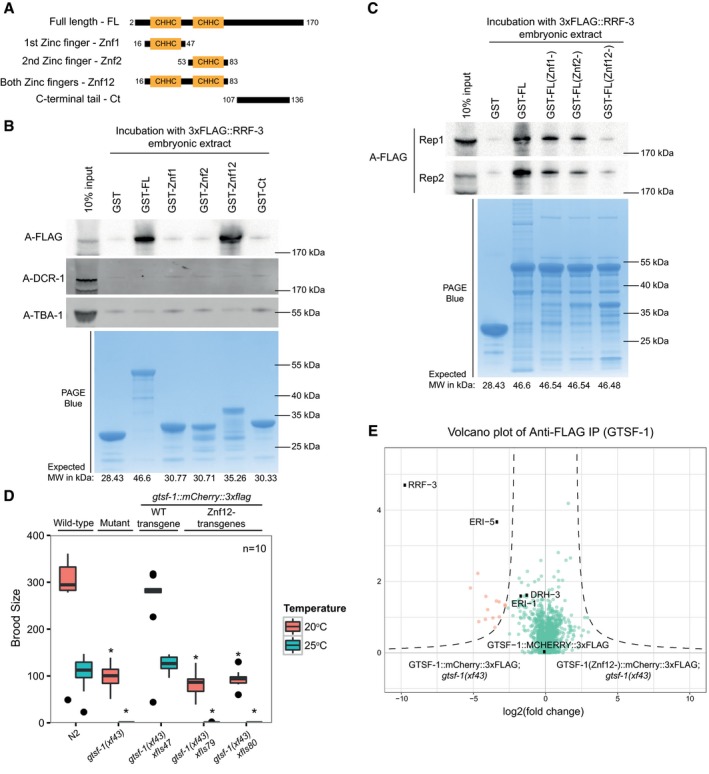
Figure 6. The tandem CHHC zinc fingers of GTSF‐1 mediate the interaction with RRF‐3.

-
ASchematic representation of GST‐fused GTSF‐1 constructs produced for this study. Amino acid residues bordering the cloned regions are indicated in the figure.
-
B, CWestern blot analysis of GST‐GTSF‐1 pull‐downs. (B) 5 μg of GST‐GTSF‐1 fusion protein (conjugated with Sepharose GSH beads, see lower PAGE Blue panel) was each incubated with approximately 1 mg of total embryonic protein extract from a 3xFLAG::RRF‐3; rrf‐3(pk1426); gtsf‐1(xf43) strain. 3xFLAG::RRF‐3 was detected using ECL, while DCR‐1 and TBA‐1 were detected using the Odyssey CLx apparatus. (C) 5 μg of various GST‐GTSF‐1 fusion proteins (conjugated with Sepharose GSH beads, see lower PAGE Blue panel), with the indicated cysteine to alanine mutations in the zinc fingers (1st Zinc finger mutated – Znf1‐; 2nd zinc finger mutated – Znf2‐; and both zinc fingers mutated ‐ Znf12‐), were each incubated with approximately 0.5 mg of total embryonic protein extract from a 3xFLAG::RRF‐3; rrf‐3(pk1426); gtsf‐1(xf43) strain. 3xFLAG::RRF‐3 pull‐down is shown for two independent biological replicates.
-
DBrood size assay at 20 and 25°C. The progenies of worms of the indicated genotype are plotted. n = 10 for every strain. Asterisks indicate P‐value < 0.0037 as assessed by Mann–Whitney and Wilcoxon tests comparing wild‐type worms with the other strains. Horizontal lines represent the median, the bottom and top of the box represent the 25th and 75th percentile. Whiskers include data points that are less than 1.5 × IQR away from the 25th and 75th percentile.
-
EVolcano plots showing label‐free protein quantification of GTSF‐1::mCherry::3xFLAG pull‐downs. Pull‐downs were performed in quadruplicate with adult worm extract. Wild‐type GTSF‐1 fusion proteins are compared with GTSF‐1 fusion proteins with zinc finger mutations (Znf12‐). Proteins in the background are represented as green dots, while orange dots show enriched proteins.
