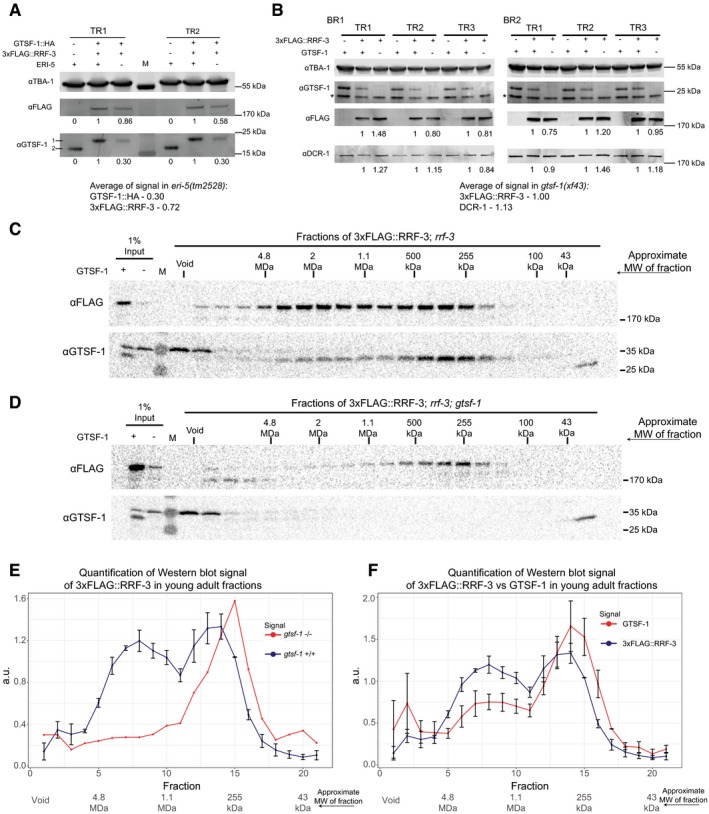
Figure EV6. Stability of ERIC factors in different backgrounds and pre‐ERIC/ERIC profiles in young adults (related to Figs 5 and 7).

-
AWestern blot relative quantification of 3xFLAG::RRF‐3 and GTSF‐1::HA with and without ERI‐5. Absence of ERI‐5 (−) indicates the presence of eri‐5(tm2528) deletion allele. Embryonic extracts were used. Double transgenic, wild‐type ERI‐5 strain was used as the reference. Two technical replicates are shown. For detection, secondary antibodies compatible with LI‐COR Odyssey CLx were used. Quantification was done by gating the region surrounding the bands using Image Studio software (v3.1). M, molecular weight marker; TR, technical replicate. For the anti‐GTSF‐1, 1 represents GTSF‐1::HA and 2 represents untagged GTSF‐1.
-
BRelative quantification of Western blot as in (A), but to address the stability of 3xFLAG::RRF‐3 and DCR‐1 in the absence of GTSF‐1 (which indicates the presence of gtsf‐1(xf43)). Embryonic extracts were used. BR, biological replicate; TR, technical replicate. Asterisk (*) indicates unspecific signal.
-
C, DSize‐exclusion chromatography of 3xFLAG::RRF‐3‐containing young adult extracts. Fractions were collected, and Western blot was performed for GTSF‐1 and 3xFLAG::RRF‐3. Fractions collected from extracts with GTSF‐1 are shown in (C), and without GTSF‐1 are shown in (D). Approximate molecular weight (MW) of the fractions is indicated in the figure. The calculation of these values according to protein standards is shown in the Appendix.
-
E, FComparison of size‐exclusion chromatography profiles of 3xFLAG::RRF‐3 and GTSF‐1 in young adult extracts. Relative quantification was performed with the Western blot signal, using ImageJ. Error bars represent standard deviation of two biological replicates, with the exception of 3xFLAG::RRF‐3 profile in the absence of GTSF‐1 (E), red line. A.u., arbitrary units. (E) Comparison of profiles of 3xFLAG::RRF‐3 in the presence of GTSF‐1 (blue line) and in the absence of GTSF‐1 (red line). (F) Comparison of profiles of 3xFLAG::RRF‐3 (blue line) and GTSF‐1 (red line).
Source data are available online for this figure.
