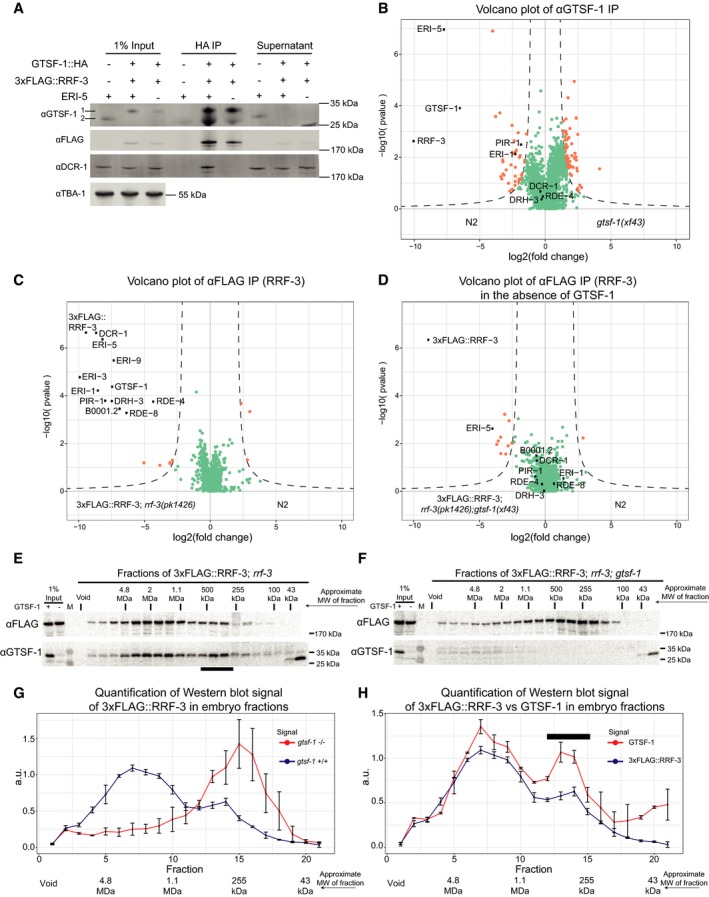
Figure 7. GTSF‐1 is required for ERIC assembly.

-
AProbing the interaction between GTSF‐1 and RRF‐3 by Western blot analysis, in embryonic extracts. GTSF‐1::HA was pulled‐down via HA immunoprecipitation. Interaction was also tested in the presence/absence of ERI‐5 by introducing an eri‐5(tm2528) mutation in the background. Multi‐channel secondary antibody detection was performed with an Odyssey CLx apparatus (see Materials and Methods). For the anti‐GTSF‐1, 1 represents GTSF‐1::HA and 2 represents untagged GTSF‐1.
-
BLabel‐free quantification of GTSF‐1 IPs in embryos (comparing wild‐type and gtsf‐1 mutant worms). IPs were done in quadruplicates, and a polyclonal anti‐GTSF‐1 antibody was used.
-
C, DVolcano plots depicting quantitative proteomic analysis of RRF‐3 pull‐downs in the presence (C) and absence (D) of GTSF‐1, in embryos. IPs were performed in quadruplicates. Proteins in the background are represented as green dots, while orange dots show enriched proteins.
-
E, FSize‐exclusion chromatography of 3xFLAG::RRF‐3‐containing embryo extracts. Fractions were collected and probed for GTSF‐1 and 3xFLAG::RRF‐3. Approximate molecular weight (MW) of the fractions is indicated. The calculation of these values according to protein standards is shown in the Appendix. Fractions collected from extracts with GTSF‐1 are shown in (E), and without GTSF‐1 are shown in (F).
-
G, HComparison of size‐exclusion chromatography profiles of 3xFLAG::RRF‐3 and GTSF‐1. Relative quantification was performed with the Western blot signal using ImageJ. Error bars represent standard deviation of two biological replicates. A.u., arbitrary units. (G) Comparison of profiles of 3xFLAG::RRF‐3 in the presence of GTSF‐1 (blue line) and in the absence of GTSF‐1 (red line). (H) Comparison of profiles of 3xFLAG::RRF‐3 (blue line) and GTSF‐1 (red line).
