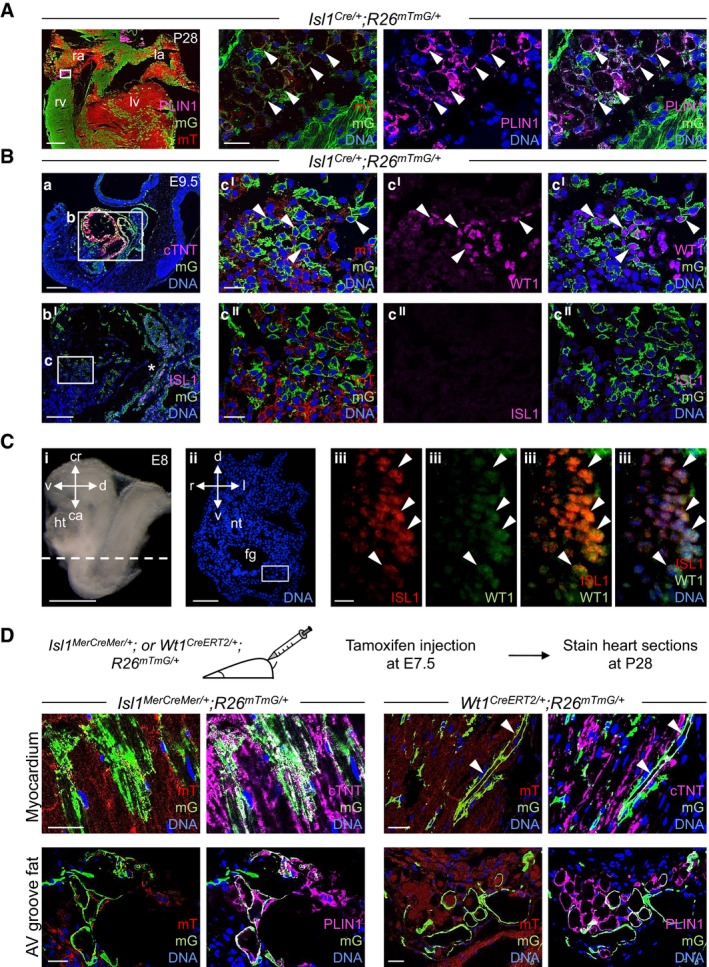
Immunofluorescence analysis of Isl1 derivatives in Isl1
Cre/+
;R26
mTmG/+ mouse hearts at postnatal d28 (P28): Plin1 (magenta), membrane GFP (mG, green), and membrane Tomato (mT, red). The three panels on the right show a magnified view of the area indicated by the white box in the left panel. Arrows indicate Plin1+/mG+ adipocytes. la, left atrium; lv, left ventricle; ra, right atrium; rv, right ventricle. Scale bars, 500 μm (left panel), 25 μm (right panels); n = 3.
Immunostaining of cTNT, Isl1 or Wt1 (all magenta), mG (green), and mT (red) in sagittal, sequential sections of Isl1
Cre/+
;R26
mTmG/+ embryos at E9.5. The boxed region in panel a is shown at higher magnification in the consecutive section in bI. cI and cII are magnifications of the boxed area in bI (in consecutive sections). Isl1‐Cre‐mediated mG labeling was observed in CMs of the forming heart (a, box b), cardiac progenitors (bI, marked by the asterisk), and a proportion of Wt1+ proepicardial cells in the PEO (cI, indicated by arrows, and cII). Scale bars, 250 μm (a), 150 μm (bI), 25 μm (cI and cII); n = 3.
Immunostaining for Isl1 and Wt1 in transverse sections of E8 embryos. A representative section corresponding to the position indicated by the dashed line drawn through the adjacent embryo view (i) is shown in panel ii after Hoechst 33258 staining of nuclei (blue). Panels iii show the boxed area in panel ii after Isl1 (red) and Wt1 (green) co‐immunostaining. Isl1+/Wt1+ progenitors and marked by the arrows in (iii). Scale bars, 2 mm (i), 200 μm (ii), 10 μm (iii). ca, caudal; cr, cranial; d, dorsal; fg, foregut; ht, heart; l, left; nt, neural tube; r, right; v, ventral; n = 3.
Temporal restriction of Cre‐mediated labeling of Isl1+ and Wt1+ progenitors and their derivatives using tamoxifen‐inducible Isl1
MerCreMer/+
;R26
mTmG/+ and Wt1
CreERT2/+
;R26
mTmG/+ mouse lines. Labeling was induced by tamoxifen treatment at E7.5, and heart sections were analyzed at postnatal day 28 (P28). Shown are representative immunostainings of cTNT or PLIN1 (magenta), mG (green), and mT (red) in sections of Isl1
Cre/+
;R26
mTmG/+ (left panels) and Wt1
CreERT2/+
;R26
mTmG/+ (right panels). Arrows indicate cTNT+/mG+ CMs. Scale bars, 25 μm; n = 3 per genotype.

