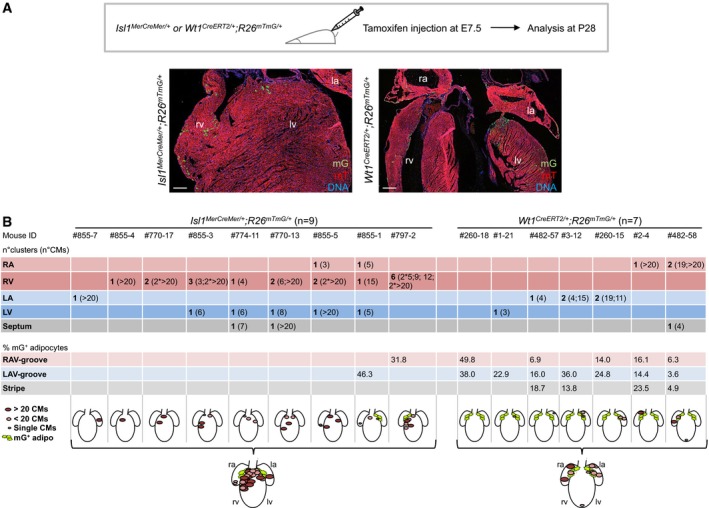
Figure EV3. Localization and quantification of mG‐labeled cells in Isl1 MerCreMer/+ ;R26 mTmG/+ and Wt1 Cre ERT 2/+ ;R26 mTmG/+ adult mouse hearts at P28.

- Temporal restriction of Cre‐mediated labeling of Isl1+ and Wt1+ progenitors and their derivatives using tamoxifen‐inducible Isl1 MerCreMer/+;R26 mTmG/+ and Wt1 CreERT2/+ ;R26 mTmG/+ mouse lines. Labeling was induced by tamoxifen treatment at E7.5, and adult mouse hearts were analyzed at postnatal day 28 (P28). Immunostaining of mG (green) and mT (red) of Isl1 MerCreMer/+ ;R26 mTmG/+ (left panel) and Wt1 CreERT2/+ ;R26 mTmG/+ (right panel). Nuclei are stained with Hoechst 33258. Scale bars, 100 μm. la, left atrium; lv, left ventricle; ra, right atrium; rv, right ventricle.
- Table depicting the regional distribution and the amount of the mG‐labeled CMs (as number of clusters and CM number/cluster) and adipocytes (as percentage of total AV groove adipocytes) in Isl1 MerCreMer/+ ;R26 mTmG/+ and Wt1 CreERT2/+ ;R26 mTmG/+ adult mouse hearts at P28. Shown are schematic representations of the distribution of mG‐expressing cells per each analyzed heart and as a summarized overview for each line. Size of CM clusters is illustrated. LA, left atrium; LAV, left atrioventricular; LV, left ventricle; RA, right atrium; RAV, right atrioventricular; RV, right ventricle.
