
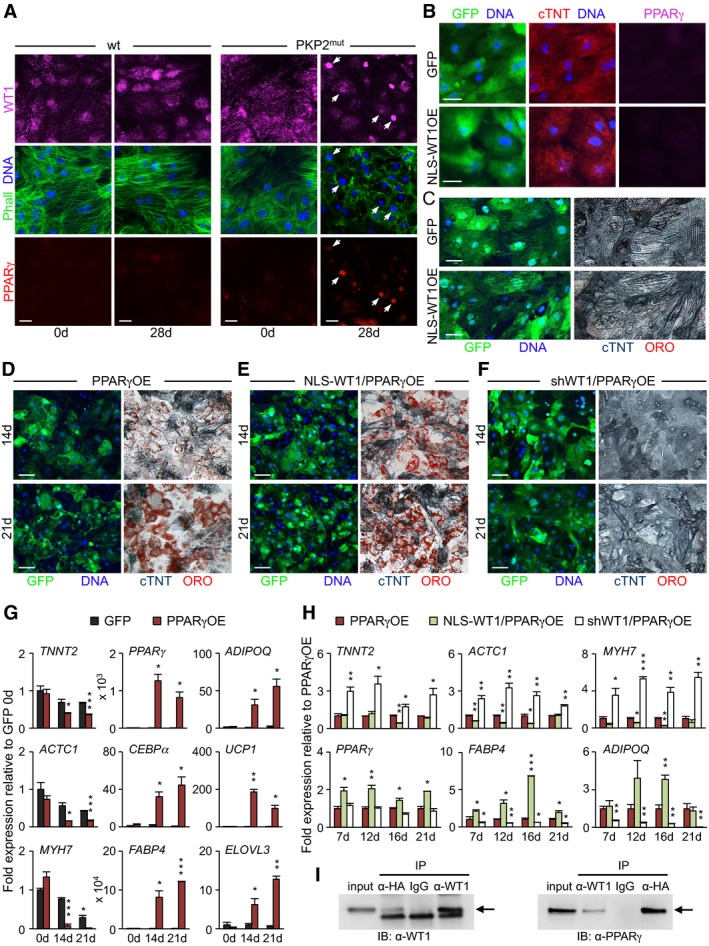
Figure 4. Cooperative role of WT1 and PPARγ in cardiomyocyte‐to‐adipocyte conversion.
-
AImmunostaining of endogenous WT1 (magenta), F‐actin (Phalloidin, green), and PPARγ (red) in wt and PKP2mut CMs at 0 and 28 days in culture. Arrows indicate PKP2mut cells with nuclear translocation of WT1, sarcomere disarray, and PPARγ activation. Scale bars, 25 μm.
-
B, CImmunocytochemistry of wt CMs after 28‐day infection with lentiviral constructs encoding the nuclear‐tagged form of WT1 (NLS‐WT1) plus GFP or GFP alone showing GFP (green), cTNT (red) and PPARγ (magenta) (B), and GFP (green, left) and cTNT (blue) in conjunction with lipid stain ORO (red, right) (C). Scale bars, 25 μm (B) and 50 μm (C).
-
D–FImmunocytochemistry of wt CMs after lentiviral overexpression of PPARγ alone (PPARγOE, D), PPARγ and NLS‐WT1 (NLS‐WT1/PPARγOE, E) or PPARγ, and shRNA targeting WT1 (shWT1/PPARγOE, F) at 14 (top) and 21 (bottom) days after infection. All constructs co‐express GFP. Representative images show GFP (green, left) and cTNT (blue) in conjunction with ORO stain (red, right) in the same cells. Scale bars, 50 μm.
-
G, HqRT–PCR analysis of myocytic and adipocytic genes in PPARγOE (G), NLS‐WT1/PPARγOE (H), and shWT1/PPARγOE (H) conditions at the indicated time points; n = 3 (PPARγOE, NLS‐WT1/PPARγOE) and n = 4 (shWT1/PPARγOE). *P < 0.05, **P < 0.01, ***P < 0.001 vs. GFP control (G) or PPARγOE (H) at the same time point (t‐test). Data are shown as means ± SEM.
-
IWt CMs were transduced with HA‐tagged PPARγ and NLS‐WT1 and cultured in adipogenic medium for 14 days. Nuclear cell lysates were precipitated using anti‐HA or anti‐WT1 followed by immunoblot (IB) analysis with an anti‐WT1 or anti‐PPARγ, and IgG was used as control; n = 3. Arrows indicate WT1 (left panel) and PPARγ (right panel) bands.
Source data are available online for this figure.