
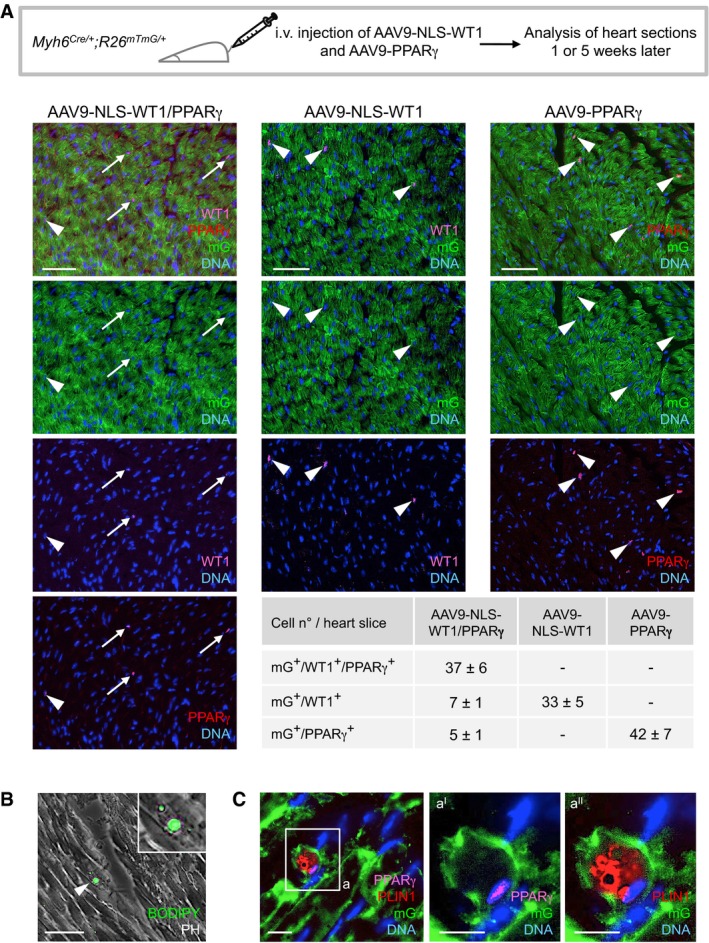
Figure EV5. Forced expression of PPARγ and WT1 drives adipocytic conversion of mouse adult CMs in vivo .
-
AScheme of experimental setup for injection of adeno‐associated virus serotype 9 (AAV9) encoding NLS‐WT1 (AAV9‐NLS‐WT1) and PPARγ (AAV9‐NLS‐ PPARγ) in Myh6 Cre/+ ;R26 mTmG/+ mice and their analysis after 1 or 5 weeks. 2.5 × 10¹² virus particles were injected intravenously via tail vein. Representative immunostainings of heart sections after 1‐week injection of each virus alone or in combination show CMs expressing the lineage marker mG (green) and the Wt1 (cyan) and PPARγ (red) transgenes. Nuclei are stained with Hoechst 33258. Arrowheads and arrows indicate mG+ CMs infected with one or both viruses, respectively. Scale bars, 50 μm. Quantification of transgene expressing mG+ CMs reveals high rate of co‐transduction. Three random heart slices per mouse and three mice per virus condition were analyzed.
-
B, CAnalysis of heart sections 5 weeks after infection with AAV9‐NLS‐WT1 and AAV9‐PPARγ. (B) shows a representative phase‐contrast (PH) image merged with BODIPY fluorescence signal (green) visualizing a lipid‐filled cell within the myocardium of a mouse that received both viruses. Higher magnification is shown in the inset. Scale bar, 50 μm. Note that BODIPY+ cells with enlarged multilocular lipid droplets were detected exclusively in the heart of mice infected with both AAV9‐NLS‐WT1 and AAV9‐PPARγ at a frequency of 3–5 cells per heart section. Arrowhead indicates a BODIPY+ cell. In (C), subsequent immunofluorescence detection of mG (green), PPARγ (magenta), and the adipocyte marker PLIN1 (red) ultimately identifies infected CMs that underwent adipocytic conversion solely in mice treated with both viruses. Scale bar, 10 μm. The boxed region is shown in higher magnification (panels aI and aII). Scale bars, 25 μm.
Source data are available online for this figure.