
Figure 5.
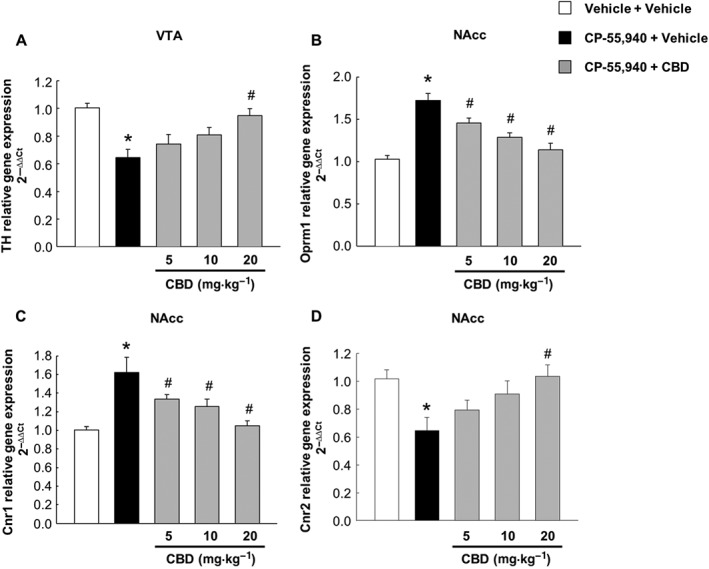
Gene expression changes induced by spontaneous cannabinoid withdrawal and subsequent CBD treatment. Evaluation of TH gene expression in the VTA (A) and of Oprm1 (B), Cnr1 (C) and Cnr2 (D) in the NAcc. Columns represent the means and vertical lines ±SEM of 2−ΔΔCt. *Values from CP‐55,940‐treated mice that are significantly different (P < 0.05) from vehicle‐treated mice. #Values from CP‐55,940 + CBD‐treated mice that are significantly different (P < 0.05) from CP‐55,940 + vehicle‐treated mice (one‐way ANOVA followed by Student–Newman–Keul's test).