
Figure 3.
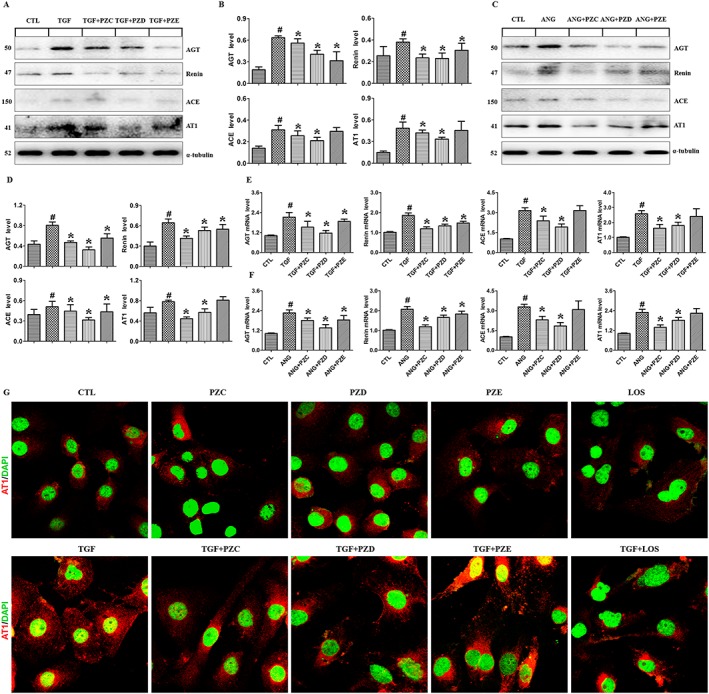
PZC, PZD and PZE suppress the activation of RAS in the TGFβ1‐ or AngII‐stimulated HK‐2 cells and podocytes. (A) Protein expression and (B) quantitative analysis of AGT, renin, ACE and AT1 receptors in the HK‐2 cells induced by TGFβ1. (C) Protein expression and (D) quantitative analysis of RAS components in the HK‐2 cells induced by AngII. qRT‐PCR analysis of the mRNA expression of genes encoding AGT, renin, ACE and AT1 receptors in the HK‐2 cells induced by TGFβ1 (E) or AngII (F). (G) HK‐2 cells stimulated by TGFβ1 were stained with primary antibody against AT1 receptors. The in situ expression of AT1 receptors was analysed by Laser scanning confocal microscopes. Representative immunofluorescent staining images of TGFβ1‐ stimulated increase in AT1 receptor expression in the different groups. # P < 0.05 compared with control group (n = 6); * P < 0.05 compared with TGFβ1‐ or AngII‐ stimulated group (n = 6). LOS, losartan.