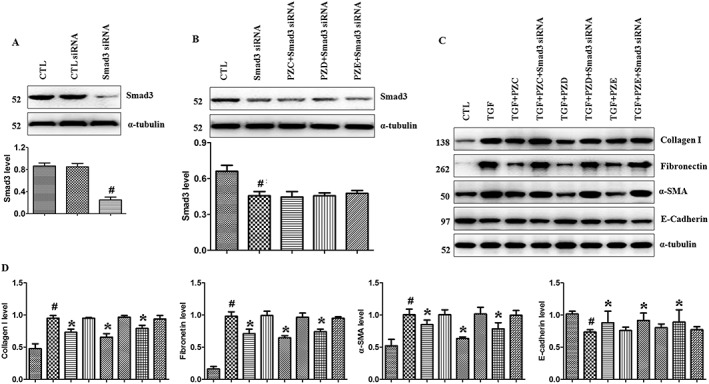
Figure 6.

PZC, PZD and PZE effects on Smad3 siRNA during TGFβ1‐stimulated tubular EMT in HK‐2 cells. (A) Knockdown of Smad3 in the TGFβ1‐stimulated HK‐2 cells. HK‐2 cells were infected with Smad3‐specific siRNA or scrambled siRNA. Smad3 protein expression was examined by Western blot analysis. # P < 0.05 compared with control (CTL) siRNA group. (B) After being infected with Smad3‐specific siRNA or scrambled siRNA, HK‐2 cells were treated with PZC, PZD and PZE without treatment with TGFβ1. Smad3 protein expression was examined by Western blot analysis. ## P < 0.01 compared with CTL group. (C) After being infected with Smad3‐specific siRNA or scrambled siRNA, TGFβ1‐stimulated HK‐2 cells were treated with PZC, PZD and PZE. Protein expression of collagen I, fibronectin, α‐SMA and E‐cadherin were detected by Western blot analysis. (D) Quantitative analysis of collagen I, fibronectin, α‐SMA and E‐cadherin expression in the HK‐2 cells induced by TGFβ1. # P < 0.05 compared with control group (n = 6); * P < 0.05 compared with TGFβ1‐induced group (n = 6).
