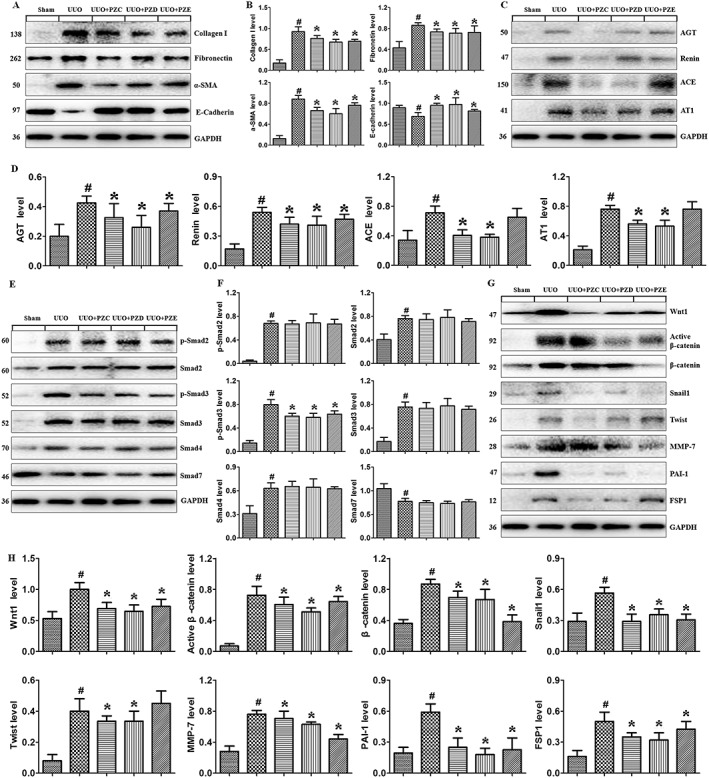
Figure 9.

Intervention effects of PZC, PZD and PZE in UUO mice. (A, B) Western blot analyses and quantitative data show protein expression of collagen I, fibronectin, α‐SMA and E‐cadherin in UUO mice and the different treatment groups as indicated. (C, D) Western blot analyses and quantitative data show protein expression of AGT, renin, ACE and AT1 receptors in UUO mice and the different treatment groups as indicated. (E, F) Western blot analyses and quantitative data show protein expression of p‐Smad2, Smad2, p‐Smad3, Smad3, Smad4 and Smad7 in UUO mice and the different treatment groups as indicated. (G, H) Western blot analyses and quantitative data show protein expression of Wnt1, active β‐catenin, β‐catenin, Snail1, Twist, MMP7, PAI‐1 and FSP1 in UUO mice and the different treatment groups as indicated. # P < 0.05 compared with sham group (n = 6). * P < 0.05 compared with UUO group (n = 6).
