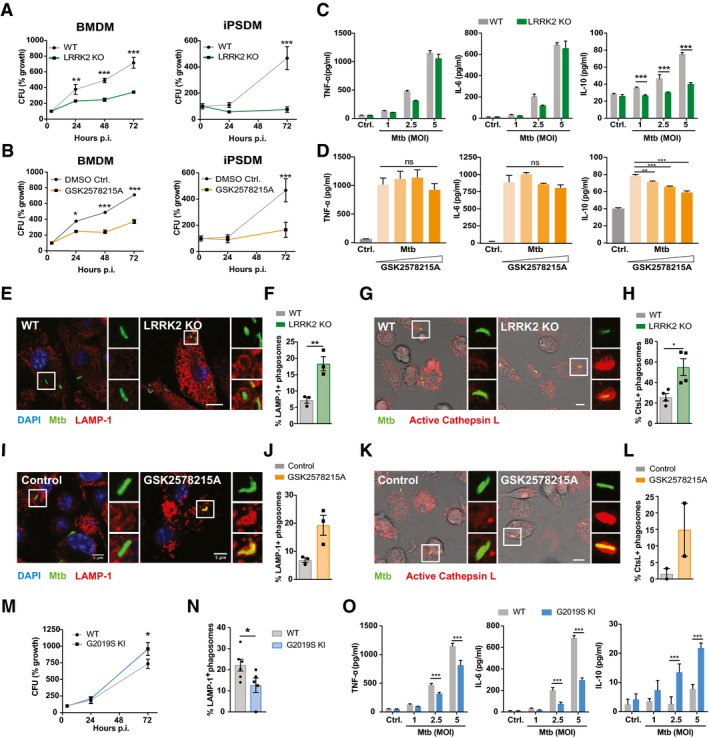
CFU from WT and LRRK2 KO mouse bone marrow‐derived macrophages (BMDMs) and WT and LRRK2 KO human‐induced pluripotent stem cell‐derived macrophages (iPSDM). One representative experiment out of four, data show mean ± SEM of technical replicates.
CFU from WT BMDM and WT iPSDM treated with 1 μM GSK2578215A. For clarity, controls are the same as for panel (A). One representative experiment out of two, data show mean ± SEM of technical replicates.
Cytokine secretion levels in BMDM measured by ELISA at the indicated MOI. One representative experiment out of three shown.
Cytokine secretion levels in BMDM infected with Mtb (MOI = 5) and treated with 0.5; 1 and 3 μM GSK2578215A as measured by ELISA. One representative experiment out of two shown.
Representative images of WT and LRRK2 KO BMDM infected with Mtb‐eGFP at 24 h after infection and stained for LAMP‐1. Nuclei were labelled with DAPI. Scale bar = 10 μm.
Quantification of LAMP‐1 co‐localisation with Mtb as in panel (E). Data show three independent experiments.
Representative images of WT and LRRK2 KO BMDM infected with Mtb‐eGFP at 24 h after infection and incubated with a substrate specific for cathepsin L as described in methods. Nuclei were labelled with DAPI. Scale bar = 10 μm.
Quantification of cathepsin L co‐localisation with Mtb from panel (G). Data show four independent experiments.
Representative images of WT BMDM infected with Mtb‐eGFP, treated with either DMSO (control) or 1 μM GSK2578215A at 24 h after infection and stained for LAMP‐1. Nuclei were labelled with DAPI. Scale bar = 5 μm.
Quantification of LAMP‐1 co‐localisation with Mtb as in panel (I). Data show three independent experiments.
Representative images of cathepsin L‐stained WT BMDM as in panel (I). Scale bar = 10 μm.
Quantification of cathepsin L co‐localisation with Mtb from panel (K). Data show two independent experiments.
CFU from WT and G2019S LRRK2 KI BMDM. One representative experiment out of two shown.
LAMP‐1 co‐localisation with Mtb was quantified as in panels (F and J).
Cytokine secretion levels in BMDM measured by ELISA at the indicated MOI. One representative experiment out of two shown.
Data information: All data show mean ± SEM. *
< 0.001, ns not significant. Panels (A, B, M)
‐test adjusted for multiple comparison; panels (C, D, O) one‐way ANOVA with Holm‐Sidak post‐test, panels (F, H, J, L, N)
‐test.