
Figure EV2. LRRK2 KO has no major impact on lysosomal morphology.
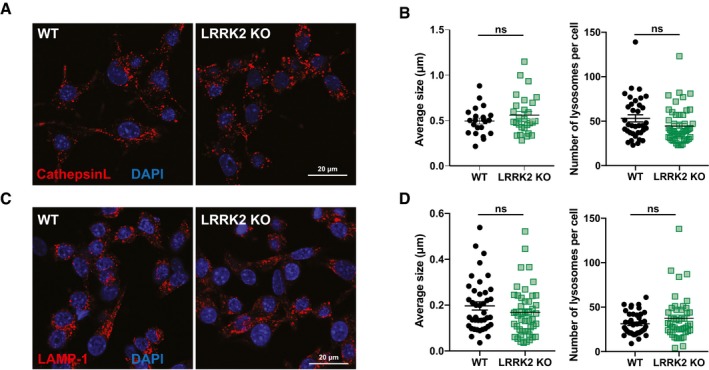
- Representative images of WT and LRRK2 KO BMDM incubated with cathepsin L probe for 30 min.
- Quantification of (A), showing average lysosomal size and numbers. Each dot represents a single cell.
- Representative images of WT and LRRK2 KO BMDMs stained for LAMP‐1.
- Quantification of (C), showing average lysosomal size and numbers. Each dot represents a single cell.