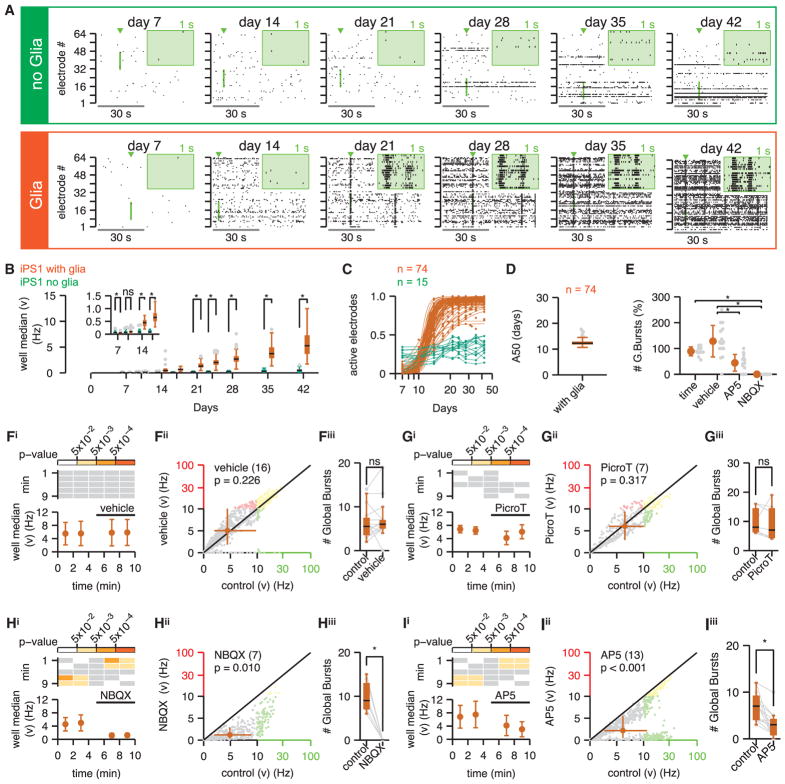
Figure 4. hpiNs Form Active Networks that Are Glutamate Receptor Dependent.
Neuronal activity was routinely sampled on MEA plates for 42 days.
(A) Representative raster plots of spontaneous activity. Neurons were cultured in isolation (top, green) or with glia co-culture (bottom, orange). Top right insets (green background) show spikes detected on 16 electrodes with an expanded 1-s time base (the exploded region is both highlighted in and marked by a green arrowhead above the main figure).
(B–E) Network activity of hpiNs. (B) Spike count (mean number of spikes in a 10-s period). The activity of neurons derived in isolation (n = 15 cultures from 3 differentiations) is compared to those co-cultured with glia (n = 74 cultures from 6 differentiations). (C) Proportion of electrodes detecting spontaneous activity, against the number of days post-induction. For neurons cultured with glia, the data were well fit by a sigmoid function. (D) Summary of the A50 from the sigmoid curve fits. The neurons cultured in the absence of glia have not been curve fit. (E) Number of burst parameters across conditions; time, time base control group that did not receive vehicle or drug (n = 12 cultures from one differentiation).
(F–I) Contribution of ionotropic glutamate and GABA receptors to spontaneous activity (at day 42) for neurons cultured with glia. Electrode mean spike count (/10 s) recorded over 10 min is shown. The solid bar above the plots highlights the addition of vehicle (F, dd.H20, n = 16 cultures from 3 differentiations) or drug (G, picrotoxin, n = 7 cultures from 2 differentiations; H, NBQX, n = 7 cultures from 2 differentiations; I, AP5, n = 13 cultures from 3 differentiations). (F–Ii) Top significant p values are shown (p values > 0.05 are in white, gray indicates that no statistical comparisons have been made). (F–Iii) Mean electrode spike counts per electrode recorded during the baseline control period (fourth minute) are plotted against the spike count recorded during the test period (ninth minute). The diagonal line of equality is plotted in black, and the orange filled circle (and bars) marks the median (and Q1–Q3). Plots are split into 4 quadrants; for paired spike counts ≤100 (gray data), the ordinate and abscissa are both plot on a linear scale, and when paired spike counts are both above 100 they are plot on log-log scale (yellow data). Otherwise data are plot on a mixed linear-log/log-linear scale (red and green, respectively). (F–Iiii) Effect of vehicle/antagonist application on the number of global bursts is shown. Bursts are analyzed for 2 min at the end of the baseline period and for 2 min after drug/vehicle application. Raw data are plotted in gray; *p value ≤ 0.05; ns, not significant.

