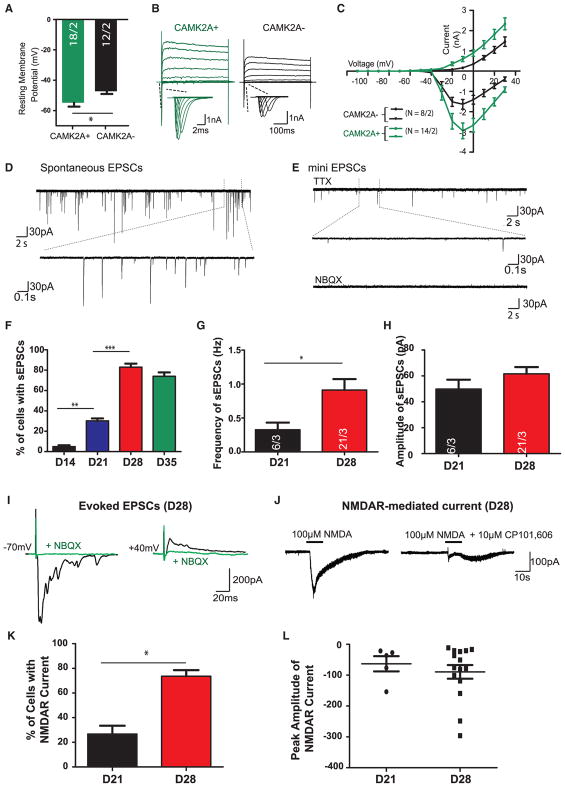
Figure 5. Time Course Characterization of the Electrophysiological Membrane Properties of CAMK2A+ Neurons over Time.
(A) Comparison of electrophysiological membrane properties of CAMK2A::GFP+ and CAMK2A::GFP− at day 21.
(B) Representative traces of whole-cell voltage-clamp Na+ and K+ currents recorded in a GFP+ cell and a GFP− at day 21. Cells were subjected to a 10-mV step depolarizations from −110 to +30 mV at a −70-mV holding membrane potential.
(C) Quantification of current/voltage (I/V) curves of Na+ and K+ currents.
(D and E) Representative traces of (D) spontaneous EPSCs and (E) miniature EPSCs in the presence of 1 μM TTX at day 28. Lower panel illustrates expansions of selected events.
(F) Percentage of cells exhibiting sEPSCs is significantly increased over time from day 14 to day 28.
(G) Quantification of the frequency of sEPSCs shows a significant increase at day 28 as compared to day 21.
(H) Quantification of the peak amplitude of sEPSCs recorded at day 21 and day 28.
(I–L) CAMK2A+ neurons mainly express GRIN2B-containing NMDA receptors.
(I) Block of spontaneous EPSCs by 10 μM NBQX at day 28. Representative traces show evoked EPSCs measured at a holding membrane potential of −70 mV (left panel) followed by a holding potential of +40 mV at day 28; the evoked EPSCs at both holding membrane potentials were blocked by 10 μM NBQX.
(J) Representative traces of whole-cell currents elicited by the application of a saturating concentration of NMDA (100 μM). Application duration is indicated by solid bars above traces.
(K) Summary of the percentage of neurons that exhibit NMDA receptor-mediated currents at day 21 and day 28.
(L) Summary of the NMDAR-mediated current density (pA/pF) at day 21 and day 28. Data are means ± SEMs. *p < 0.01, **p < 0.005, and ***p < 0.001, unpaired Student’s t test.

