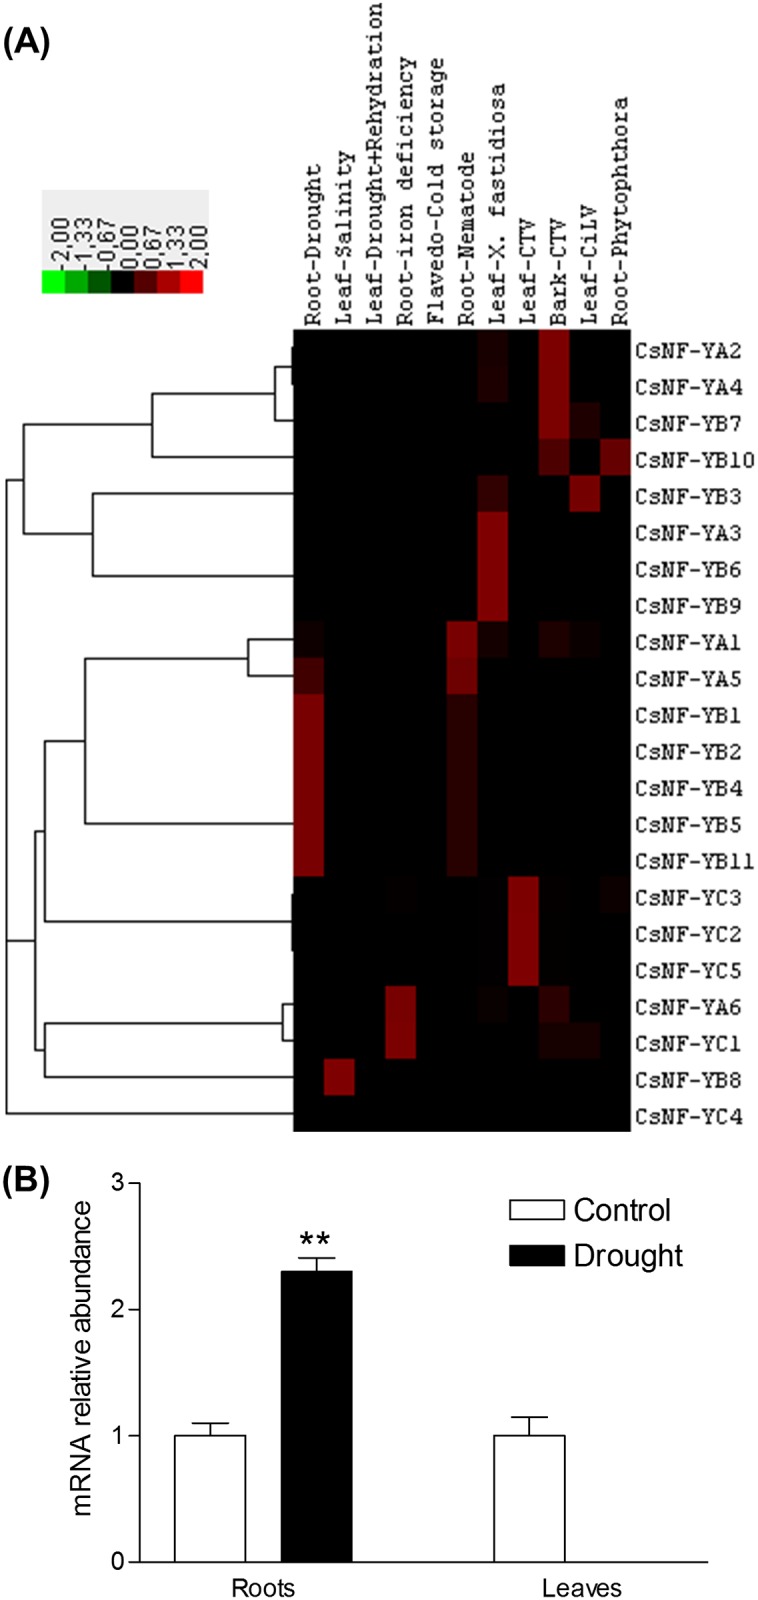
Fig 3. Expression analysis of CsNF-Ys.

Heatmap of expression of CsNF-Ys in response to different stress treatments (A). The color scale shown represents TPM-normalized log2-transformed counts. qRT-PCR expression analysis of CsNF-YA5 (B). CsNF-YA5 mRNA abundance in leaves and roots of sweet orange plants grafted on Rangpur lime, subjected to control (irrigated) and drought treatments. The data are means ± SE of three biological replicates in which β-actin transcripts were used as internal controls.**Significantly different from control treatment at P ≤ 0.01.
