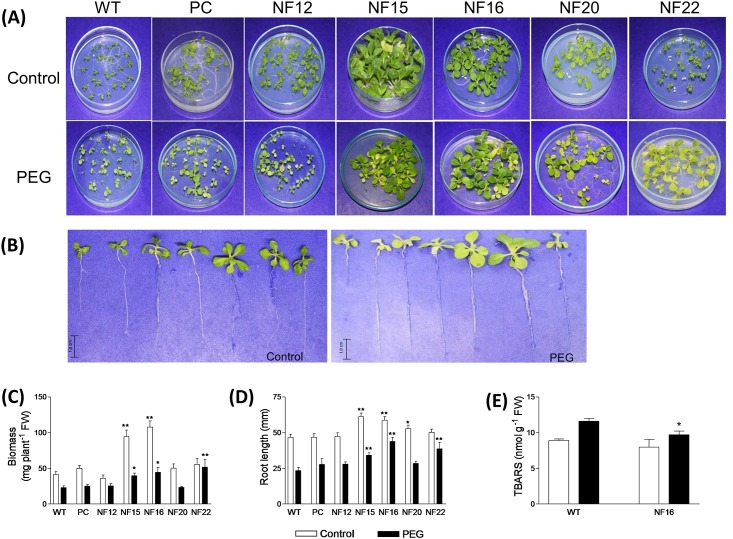
Fig 5. In vitro drought stress tolerance assay of CsNFYA5-overexpressing transgenic lines.
Representative phenotypes of control (WT and PC) and CsNFYA5 transgenic (NF12, NF15, NF16, NF20 and NF22) lines grown under control and PEG treatments for 30 days (A, B). Shown from left to right in panel B: WT, PC, NF12, NF15, NF16, NF20 and NF22. Seedling biomass and root length, respectively, of control and transgenic lines under control and PEG treatments for 30 days (C, D). The data are means ± SE of five technical replicates composed of fifteen seedlings for each line. Total thiobarbituric acid reactive substances (TBARS) concentration in seedlings of WT and transgenic line NF16 under control and PEG treatments for 30 days (E). The data are means ± SE of six technical replicates composed of fifteen seedlings for each line. Statistically significant differences at P ≤ 0.01 (**) or P ≤ 0.05 (*) between control (WT) and CsNFYA5 transgenic lines, at the respective treatment, are indicated.

