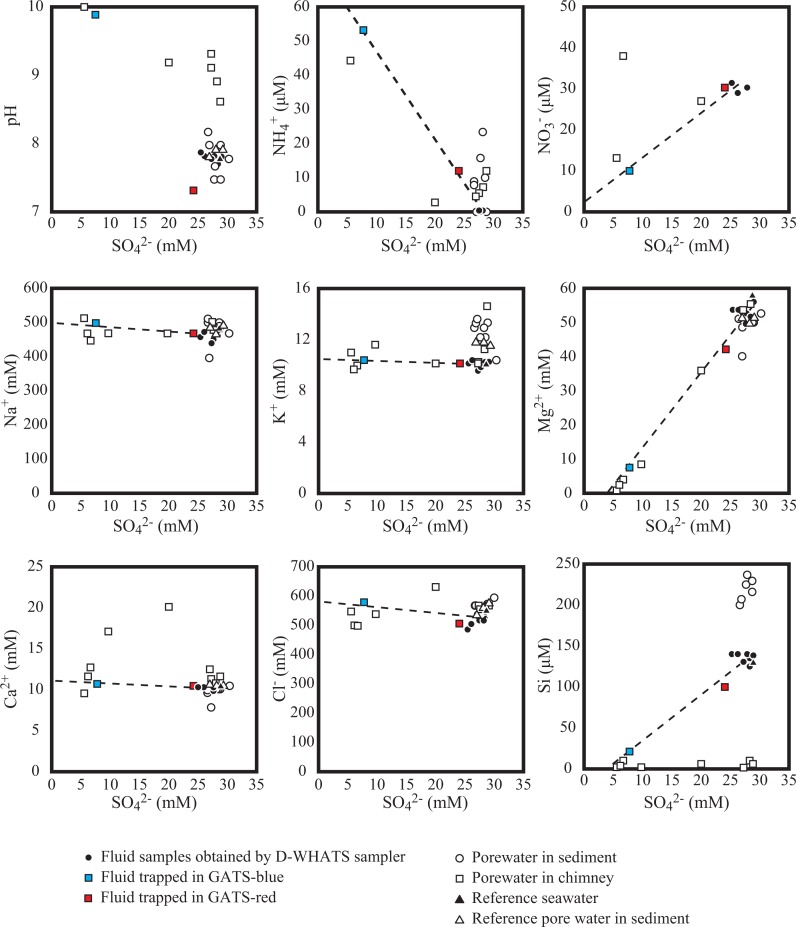
Fig 2. Plots of sulfate concentrations versus each component of the studied water samples.
Filled circles represent samples collected from around the clam colonies and near the chimneys in the SSF. Filled black squares represent the results of the fluid samples, excluding the GATS fluids. Filled red and blue squares represent the results of GATS-red and -blue fluids, respectively. Open circles and squares represent the pore water samples squeezed from sediments beneath the clam colony and the brucite-carbonate chimneys, respectively. Dashed lines represent a plausible mixing line between fluid samples containing GATS fluids and the ambient seawater.

