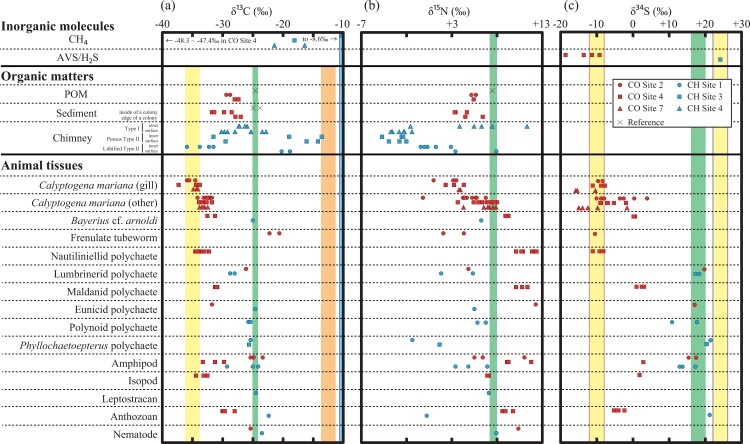
Fig 4. Compilation of the carbon (a), nitrogen (b), and sulfur (c) isotopic compositions analyzed in this study.
In (a) and (b), yellow, orange, blue, and green shadows represent the expected ranges of the isotopic compositions of thiotroph-CBB, thiotroph-rTCA, methanotroph in CH Sites, photosynthetic organic matter (Table 3). The ranges of methanotroph in CO Sites are not shown. In (c), green shadow represents the expected ranges of the δ34S values of photosynthetic organic matter and methanotroph (δ34Ssulfate) and yellow shadows with red and blue lines, respectively, represent the δ34S values of thiotrophs (δ34Ssulfide) in CO and CH Sites.

