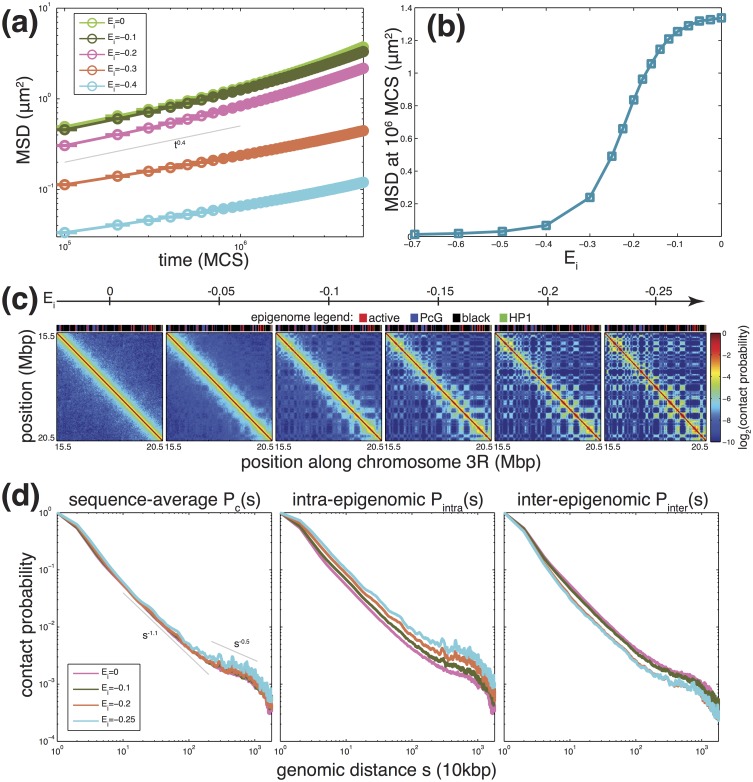
Fig 5. Dynamical and structural properties predicted by the model.
(a) Average mean-squared displacement (MSD) along simulated trajectories as a function of simulation time in Monte Carlo step (MCS)-unit, for different values of the specific epigenomic-driven contact energy Ei (in kB T-unit). (b) Average MSD after 106 MCS as a function of Ei. (c) Evolution of the average (between 0 and 20h) contact maps for the region located between 15.5 and 20.5 Mbp of chromosome 3R as a function of Ei. We also plot on top the underlying epigenomic landscape. (d) Average contact probability as a function of the genomic distance s between any pairs of monomers (left), between pairs of monomers having the same (center) or different (right) epigenomic state. Grey lines represent scaling laws.

