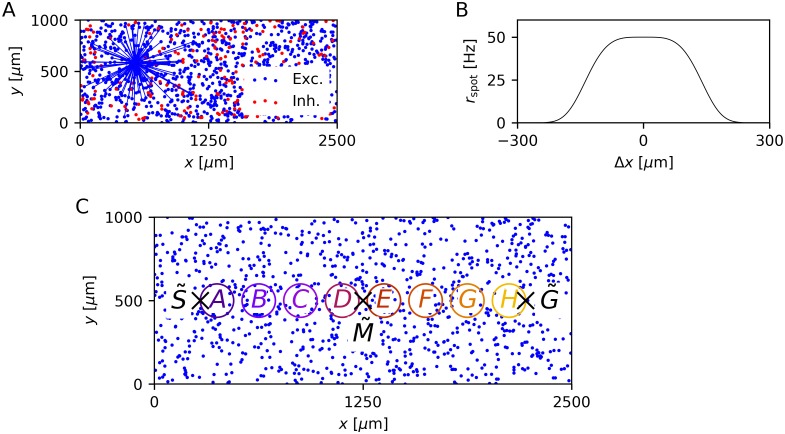
Fig 1. Network architecture and modeling of the study by Xu et al. [1] in the LIF-SORN.
(A) Distribution of neurons on the 2D grid of one network instance. Blue lines show all connections projecting from the excitatory population to an example excitatory neuron after 500 s of simulation time. Connections spanning a larger distance are unlikely to exist, due to the distance dependent connection probability. (B) Cross-section of the rate rspot of the Poissonian input spike trains with Δx being the distance to the center of the spot. (C) Distribution of the excitatory neurons including the start point , mid point and end point of the trajectory of the moving spot used in most experiments. The colored circles define the neurons that are pooled together for the analysis of the sequence learning ability.

