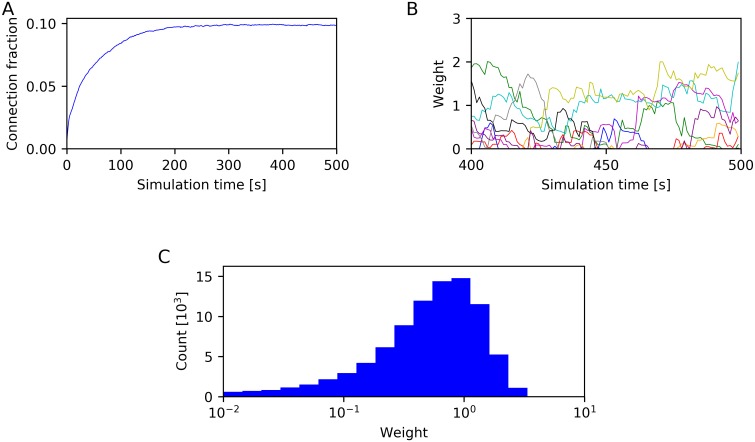
Fig 3. Characterization of network connectivity.
(A) Connection fraction of recurrent excitatory connections. (B) Time course of the weights of 10 randomly selected recurrent excitatory connections after the connection fraction has stabilized. (C) Distribution of the weights of existing recurrent excitatory connections, determined after 500 s of simulation time. Data from a single network instance.

