
Figure 9.
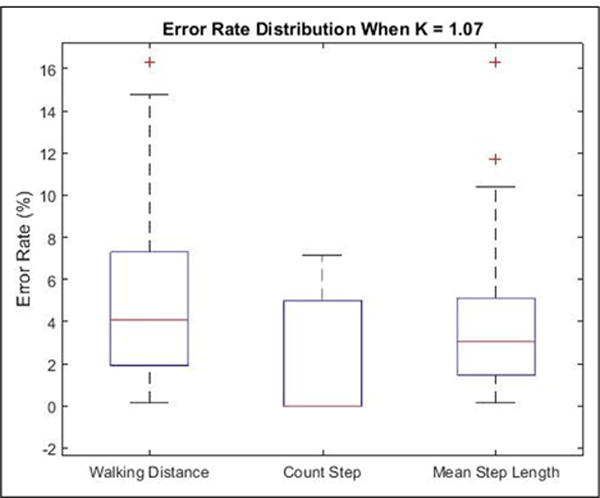
Box plot of error rate distribution of walking distance, number of steps, and mean step length. In each box, the central line represents the median error rate, and the bottom/top edges of the box are the first and third quartiles, and in the second box, the median error rate and the first quartiles error rate are both equal to zero. The outliers are plotted individually as plus sigh (+).