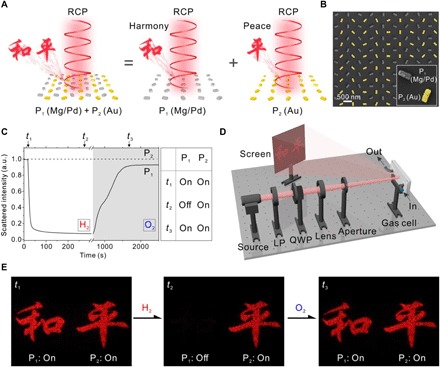
Fig. 2. Metasurface hologram with dynamic and static patterns.

(A) Two holographic patterns, harmony and peace, reconstructed from two independent phase profiles containing Mg/Pd (P1) and Au (P2) nanorods as dynamic and static pixels, respectively. Ti is omitted for conciseness. The two sets of pixels are merged together with a displacement vector of (300 nm, 300 nm). (B) Overview SEM image of the hybrid plasmonic metasurface. The Au (P2) nanorods are represented in yellow color. Inset: Enlarged SEM image of the unit cell (600 nm × 600 nm). (C) Time evolutions of P1 (solid line) and P2 (dashed line) during hydrogenation and dehydrogenation. The scattered intensities at resonance peak positions of P1 and P2 are used to track the dynamic processes, respectively. P1 can be switched off/on through hydrogenation/dehydrogenation, whereas P2 stays at the on state. (D) Schematic of the optical setup for capturing the holographic images. QWP, quarter-wave plate; LP, linear polarizer. (E) Representative snapshots of the holographic images during hydrogenation and dehydrogenation. Harmony (left) can be switched off/on using H2/O2, whereas peace (right) stays still.
