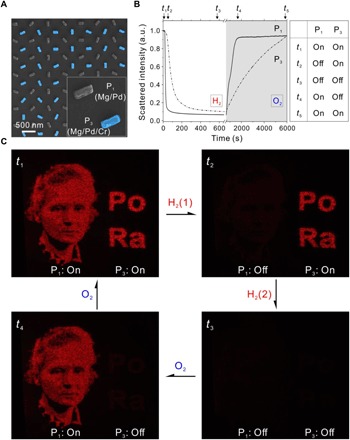
Fig. 3. Metasurface hologram with differently sequenced dynamics.

(A) Mg/Pd (P1) and Mg/Pd/Cr (P3) nanorods work as dynamic pixels with different reaction kinetics. Overview SEM image of the hybrid plasmonic metasurface as well as the enlarged SEM image of the unit cell (600 nm × 600 nm). The Mg/Pd/Cr (P3) nanorods are represented in blue color. (B) Time evolutions of P1 (solid line) and P3 (dash-dotted line) during hydrogenation and dehydrogenation. The scattered intensities at resonance peak positions of P1 and P3 are used to track the dynamic processes, respectively. (C) Representative snapshots of the holographic images during hydrogenation and dehydrogenation. H2(1) or H2(2) refers to a hydrogenation process until the first or second feature completes transition. Both the portrait of Marie Curie and the chemical elements Po and Ra can be switched on and off independently.
