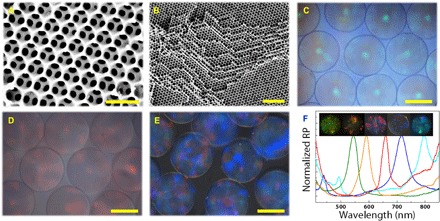
Fig. 2. SEM images and metalloscope images of the inverse opal particles.

(A) The surface and (B) the inner side of an inverse opal particle with a higher concentration of the cross-linker. (C to E) Reflection images of the green, red, and blue inverse opal particles. (F) Reflection peaks and reflection images of five different inverse opal particles. RP, reflective percent. Scale bars, 500 nm (A), 2 μm (B), and 100 μm (C to E).
