
Fig. 3. PiFM imaging and extinction cross section of the nanodiscs.
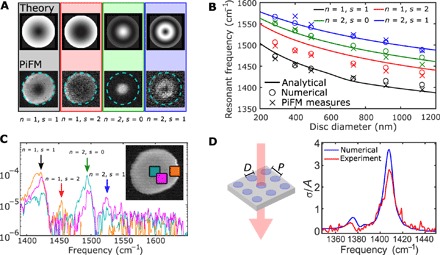
(A) Hyperspectral PiFM imaging of the first four resonance modes (for a disc of 730 nm in diameter) compared with the expected analytical mode profile. For s = 0, the profile is given by |ρ|2 of the mode; for s > 0, the profile is the sum of |ρ|2 of the sine and cosine modes. (B) Comparison of resonance frequencies of several disc modes computed analytically and numerically (using Lumerical FDTD) and measured with PiFM. (C) From the same hyperspectral measurement, spectra can be obtained in various points of the disc, confirming the resonant frequency of the modes in discs down to several tens of times smaller than the free space wavelength (about 7 μm). The quality factors of the resonant modes are about Q1 = 180, Q2 = 210, Q3 = 300, and Q4 = 180. (D) Transmission FTIR measurements of an array of h-BN nanodiscs on high-resistivity silicon (disc diameter D = 480 nm; periodicity P = 1.25 μm). The fundamental dipole mode (s = 1, n = 1) can be clearly seen, and the extinction cross section is about three times the actual area A of the disc. Quality factor is Q1 = 120. The fundamental dipole mode has a resonance frequency always above the phonon resonance (1360 cm−1), and this blueshift can be explained considering that the electrostatic field induced by the polarization of the disc acts as an additional restoring force, which blueshifts the overall resonance of the system.