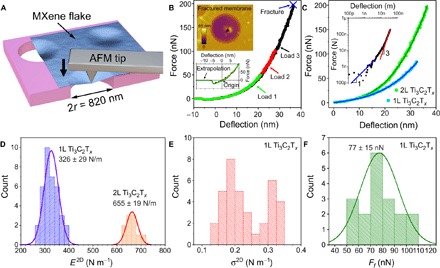
Fig. 2. Elastic response and indentation test results.

(A) Scheme of nanoindentation of a suspended Ti3C2Tx membrane with an AFM tip. (B) Force-deflection curves of a bilayer Ti3C2Tx flake at different loads. The bottom inset is a detailed view of the same curves showing the center of origin. The top inset shows AFM image of the fractured membrane. (C) Comparison of loading curves for monolayer (1L) and bilayer (2L) Ti3C2Tx membranes and the least squares fit to the experimental indentation curves by Eq. 1. Hole diameter is 820 nm. The inset shows the same experimental curve for bilayer Ti3C2Tx in logarithmic coordinates. The curve shows a linear behavior in the first 10 nm of indentation (blue line) and approaches the cubic behavior at high loads (red line). (D) Histogram of elastic stiffness for monolayer and bilayer membranes. Solid lines represent Gaussian fits to the data. (E) Histogram of pretensions of monolayer membranes. (F) Histogram and Gaussian distribution of breaking forces for monolayer membranes. Tip radius is 7 nm.
