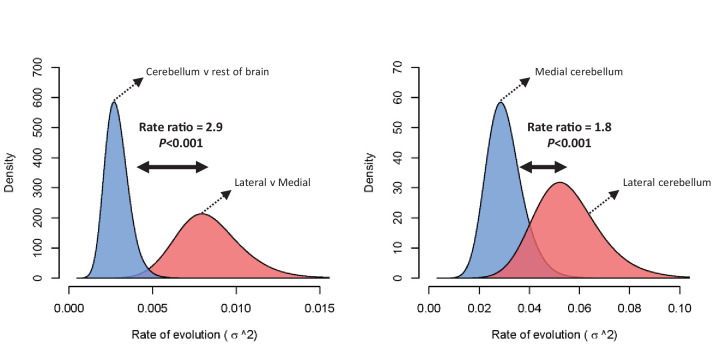
Figure 4. Rate of evolution (σ2) for relative cerebellum size and lateral-medial cerebellar reorganization (left panel), and medial and lateral cerebellar volume (right panel) as estimated by a standard Brownian motion model (Revell, 2012).
Rate ratios and P values are calculated using Q-mode rate analysis (Adams, 2014). Reversible-jump (Venditti et al., 2011) and multiple variance (Smaers et al., 2016) Brownian motion models yield equivalent results.

