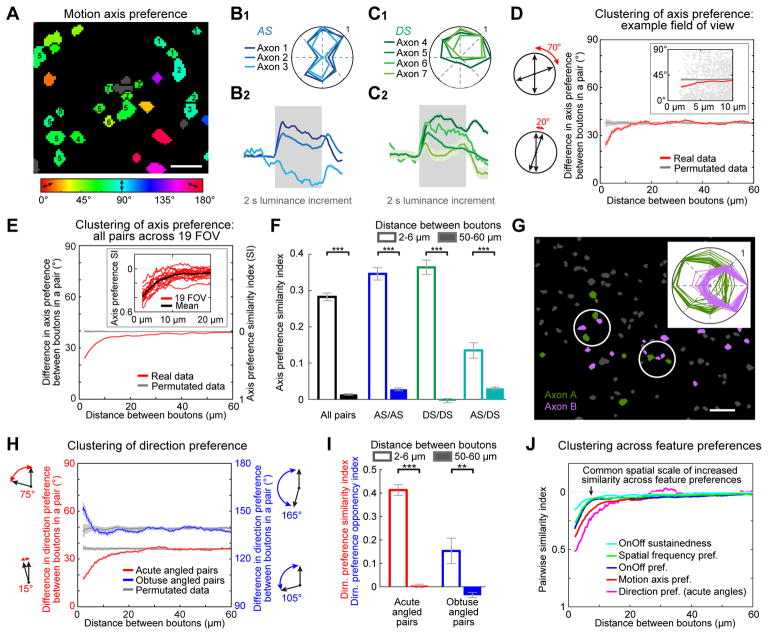
Figure 4. Fine-scale functional organization of visual feature preferences in RGC boutons.
A. RGC boutons from a subregion of an example FOV, each colored according to its preferred motion axis (gray: no preference).
B–C. Average direction tuning curves (top) and normalized response timecourses during full-field luminance increments (bottom) for AS (B) and DS (C) axons numbered in panel A. These nearby axons preferred similar directions of motion (Axons 4–7) and/or similar axes of motion (Axons 1–7). Nevertheless, Axons 1 and 5–7 had ‘On’ responses at stimulus onset, while Axon 3 had an ‘Off’ response at stimulus offset and Axons 2 and 4 had both On and Off responses. Timecourses are mean ± s.e.m. across boutons from each axon.
D. Left: schematics illustrating calculation of difference in axis preference for a pair of boutons. Right: average absolute difference in motion axis preference vs. inter-bouton spacing (red, mean ± s.e.m., 4 μm sliding window) for an example FOV (generated from 87,827 pairs for which both boutons had well-defined axis preferences and belonged to different axons). Gray: same analysis following random permutation of differences in axis preference across all bouton pairs spaced 2–150 μm apart. Inset: zoomed-in scatter plot of pairs spaced 2–10 μm apart.
E. Same as D, but including all bouton pairs (from 19 FOV, 5 mice). Inset: functional clustering of axis preference for nearby boutons was evident in every FOV. SI: axis preference similarity index (1: perfect similarity; 0: chance similarity).
F. Mean axis preference similarity index for pairs of boutons spaced 2–6 μm apart (hollow bars; # of pairs: all pairs: 3258; AS/AS: 1383; DS/DS: 1066; AS/DS: 809) and 50–60 μm apart (solid bars; all pairs: 70,522; AS/AS: 28,736; DS/DS: 18,525; AS/DS: 23,261). AS/DS pairs are composed of one AS and one DS bouton. ***p < 0.001; Mann-Whitney-Wilcoxon test.
G. Example FOV and direction tuning curves (inset) for boutons from two DS axons (green and purple) with opposite direction preferences. Inter-axonal bouton pairs were often in close proximity (white circles).
H. Two forms of clustering of DS/DS bouton pairs. For pairs with preferences differing by <90° (i.e. by acute angles: N=159,282 pairs, 19 FOV, 5 mice), nearby pairs tended to prefer similar directions (red: mean absolute difference in direction preference). For pairs with preferences differing by >90° (i.e. by obtuse angles: N=64,487 pairs), nearby pairs tended to prefer opposite directions (blue). Gray: same analysis following permutation of differences in direction preference across pairs spaced 2–150 μm apart. Error bars, s.e.m.
I. Mean direction preference similarity index for all DS/DS bouton pairs with preferences differing by <90° (red; 1: identical direction preferences; # pairs 2–6 μm apart: 884; 50–60 μm apart: 13,241) and by >90° (blue; 1: opposite direction preferences; # pairs 2–6 μm apart: 182; 50–60 μm apart: 5,284). **p < 0.01; ***p < 0.001; Mann-Whitney-Wilcoxon test.
J. Direct comparison of pairwise similarity indices across feature preferences.
See also Figure S4.

