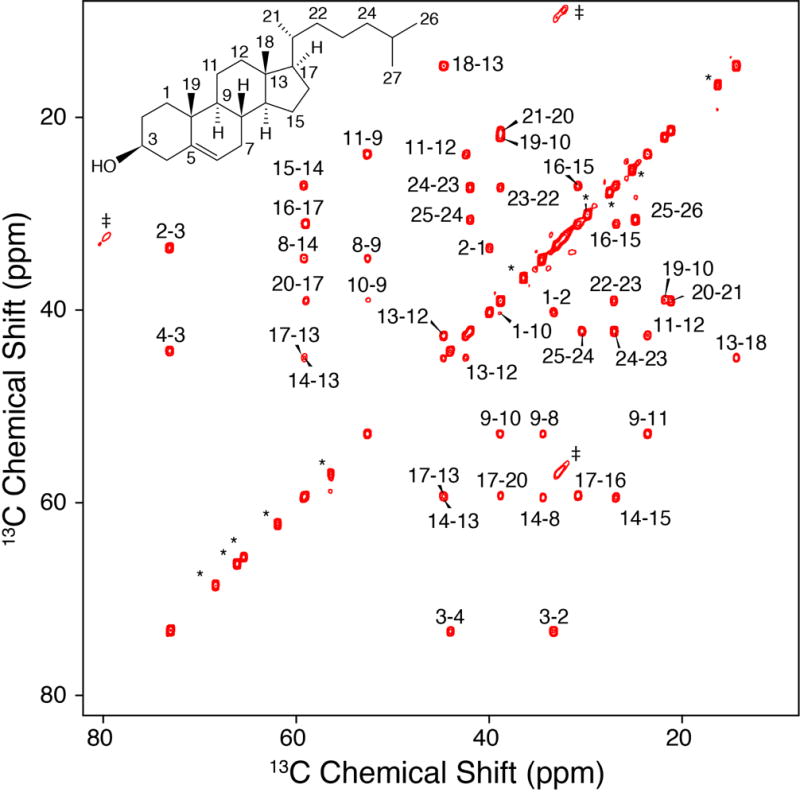
Figure 2. CTUC COSY of U-13C-Chol in POPC Bilayers.

750 MHz, 8.928 kHz MAS SSNMR 13C-13C 2D CTUC COSY spectrum of 40:1 POPC: U-13C. The asterisks in the figure represent POPC peaks, the daggers represent artifacts arising from the subharmonics of the spinning [35].
