
Figure 7.
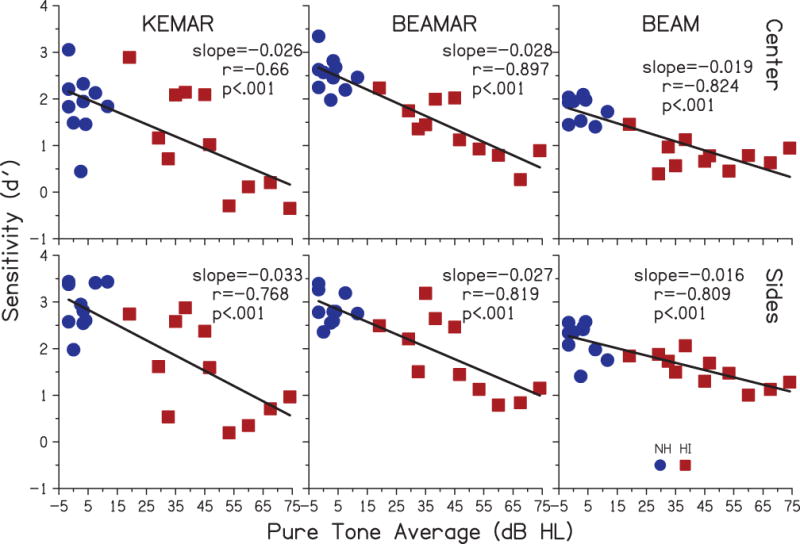
Individual sensitivity (d′) results plotted as a function of pure-tone average for NH (blue circles) and HI (red squares) listeners for all three microphone conditions for targets in the Center and on the Sides. The line within each panel is the regression fit to the data, with corresponding slope, Pearson correlation coefficient (r), and p-value in each panel.