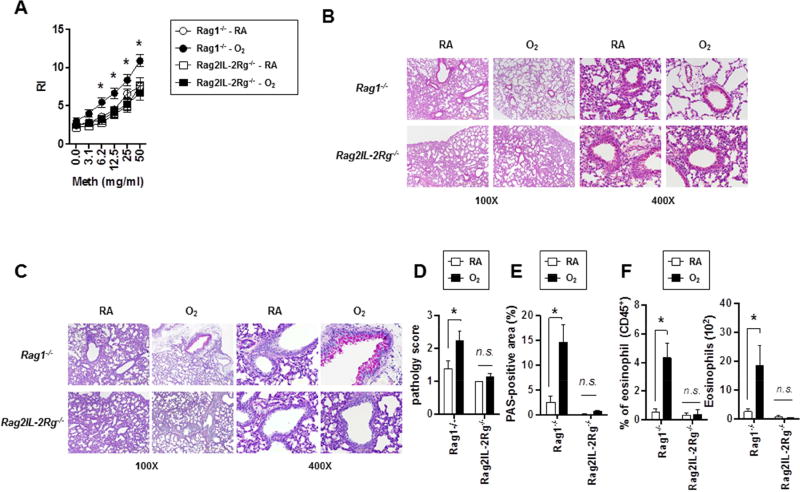
Figure 3. AHR development and pulmonary type 2 inflammation following neonatal hyperoxia are mediated by ILC2s.
(A) Neonatal mice were exposed to RA or O2 as in Fig. 1A and airway resistance (RL) was determined at PN 28. n=4 to 11 mice per group (mean ± SEM).
(B and C) Lung sections were stained with H&E (B) or PAS (C).
(D) Pathology scores on PAS staining sections were quantified. n=9 or 10 mice per group (mean ± SEM).
(E) % of PAS-positive areas within airway epithelium was calculated by image analysis. n=9 or 10 mice per group (mean ± SEM).
(F) The frequencies and absolute numbers of airway eosinophils were measured by flow cytometry. n=4 mice per group (mean ± SEM).
Data are representative of at least two independent experiments. n.s., not significant; * P ≤ 0.05.

