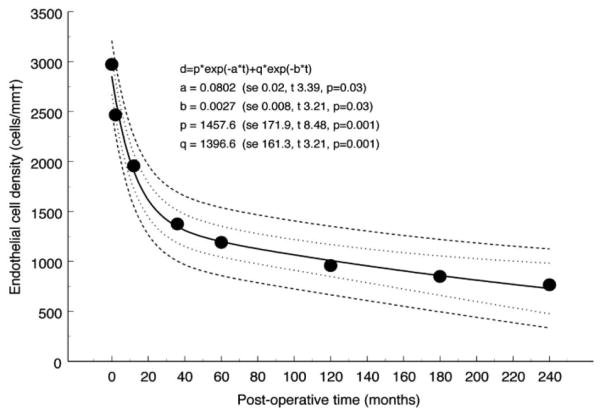
Figure 4. Endothelial cell loss after PK.
Bi-exponential model fitted to data from Bourne25 showing 95% confidence interval (inner dotted lines) and 95% prediction interval (outer dashed lines). The coefficients are shown with their respective standard error (se) and the corresponding values for t and p. The half times for the fast and slow components of the model, calculated from the relevant exponential rate constants, are 8.6 and 257 months, respectively. The residual standard deviation was 109.6 cells/mm2. 12 (Adapted from Armitage et al with permission from IOVS)

