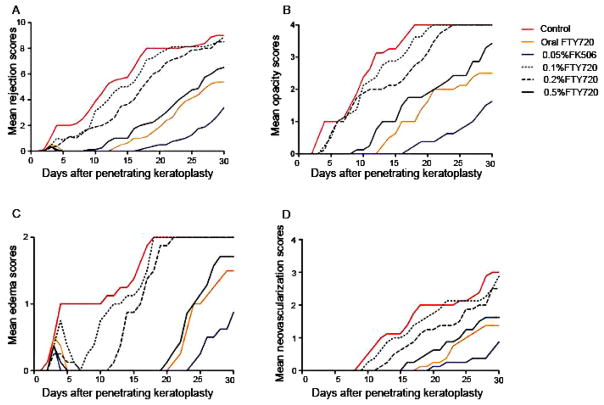
Figure 6. Average clinical finding scores for corneal rejection in all groups throughout the entire follow-up period.
(a) Mean rejection scores; (b) mean opacity scores; (c) mean edema scores; and (d) mean neovascularization scores. The results obtained for the 0.5% FTY720 (Fingolimod) group, the oral FTY720 group, and the 0.05% FK506 (Tacrolimus) group were significantly lower than those obtained for the control group (all p < 0.05). 119 Adapted from Liu et al with permission from NPG)

