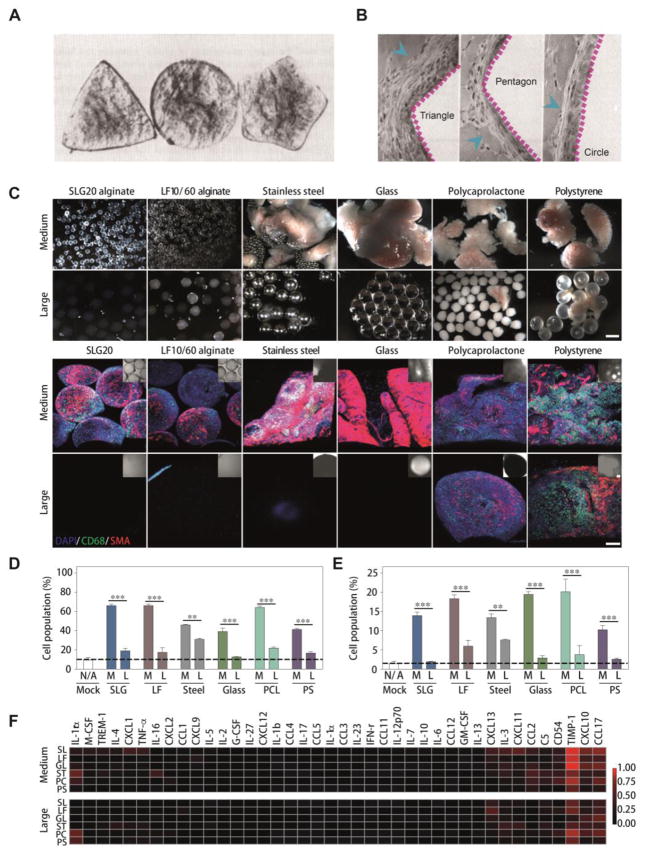
Fig. 5.
Size and shape effects of injected or implanted materials. (A) Three typical shapes of implants that are used to evaluate the FBR. Adapted with permission from reference [129] (B) Photomicrographs of H&E-stained sections after treatments by different shaped implants for 14 days. Blue arrows indicate the accumulated cells. Adapted with permission from reference [129]. (C) Bright-field images of different materials with distinct sizes after implantation for 14 days (upper panels). Immunofluorescence Z-stacked confocal images of retrieved materials. Blue (DAPI) indicates cell nuclei, green (CD68) indicates macrophages, and red (α-SMA) indicates fibrosis-associated activated myofibroblasts (lower panels). Scale bar, 300 μm. (D) Flow analysis using specific markers for the host macrophage. (E) Flow analysis using specific markers for the host neutrophils. (F) Cytokine array profiling of inflammatory cytokine protein production in response to implanted materials. Fig. 5C–F were adapted with permission from reference [126].

