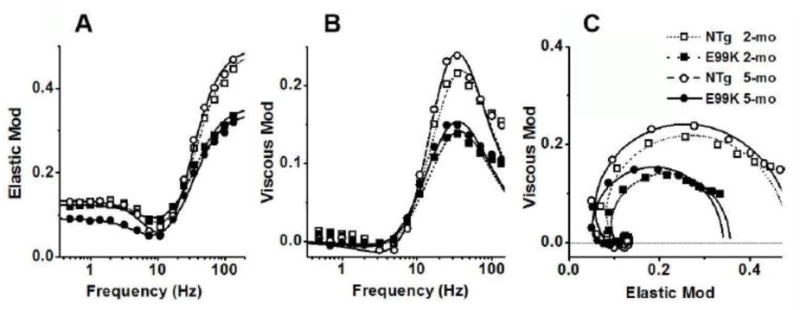
Fig. 2.

Complex modulus during the standard activation. (A) Frequency plot of elastic modulus, (B) frequency plot of viscous modulus and (C) plot of viscous modulus vs. elastic modulus (Nyquist plot). Averaged data for 23 experiments (NTg, 2-mo), 23 experiments (E99K, 2-mo), 25 experiments (NTg, 5-mo) and 30 experiments (E99K, 5-mo). The continuous lines represent best fit of the data to Eq. 1.
