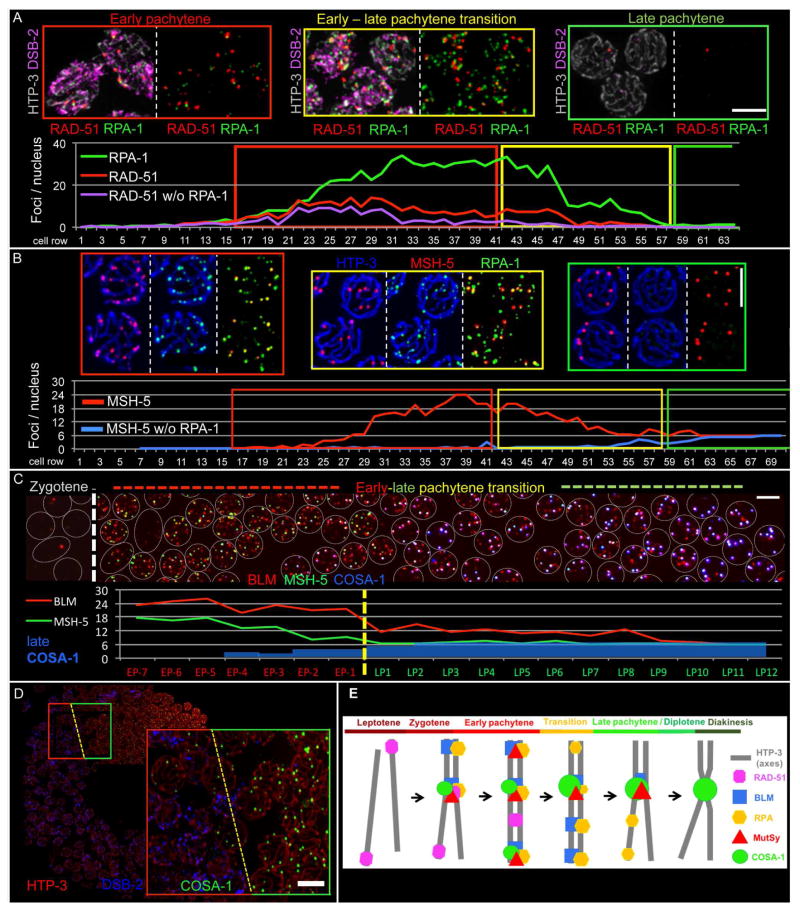
Fig. 1. Localization of RAD-51, RPA, BLM, MSH-5 and COSA-1 during meiotic prophase (see also Figs S1–S2).
(A) Top: Representative images of meiotic stages in a spread WT gonad (also see Fig S1B). DSB-2 indicates nuclei in early prophase, and HTP-3 marks chromosome axes. (B) Top: Representative nuclei from a spread gonad. (A and B) Bottom: Quantitative displays of appearance, disappearance and co-localization of indicated foci in a single gonad (distinct from the examples depicted). (C) Top: Image of the early-to-late pachytene transition region of a spread gonad, with individual nuclei represented by white circles. Bottom: Quantitative display of BLM, MSH-5 and late COSA-1 foci in the portion of the gonad shown above. (D) Left: WT gonad expressing GFP::COSA-1. Right: enlargement of the early (red outline) to-late (green) pachytene transition, coinciding with the appearance of six late COSA-1 foci. Scale bars (in A–D): 5 μm. (E) Schematic of appearance and disappearance of recombination factors at recombination sites during meiotic prophase.

