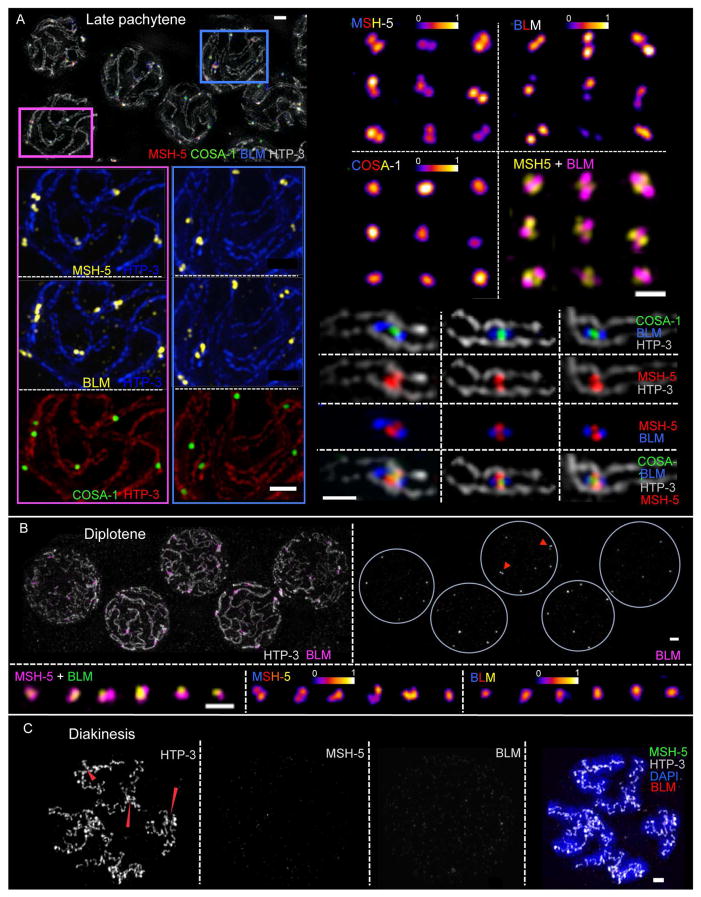
Fig. 3. SIM images of late prophase CO-designated recombination sites.
(A) Left: Representative late pachytene nuclei (top) and enlargements of portions of this field (below). Right: Individually-cropped recombination sites. Examples displayed show CO-designated sites at chromosome segments imaged in frontal aspect, illustrating two populations of BLM (oriented in parallel with the chromosome axes), two populations of MSH-5 (oriented perpendicular to the axes) and a single population of COSA-1 at the center. Scale bars: 1 μm (left) and 500 nm (right). (B) Top: diplotene nuclei; most BLM signals are no longer reliably resolved as doublets; arrowheads highlight rare examples of BLM doublets. Scale bar: 1 μm. Bottom: Individually-cropped diplotene recombination sites. Scale bar: 500 nm. (C) Diakinesis nucleus. Red arrowheads indicate chiasmata, temporary connections between desynapsed homologs that reflect the formation of COs; BLM and MSH-5 are no longer detected. Scale bar: 1 μm.

