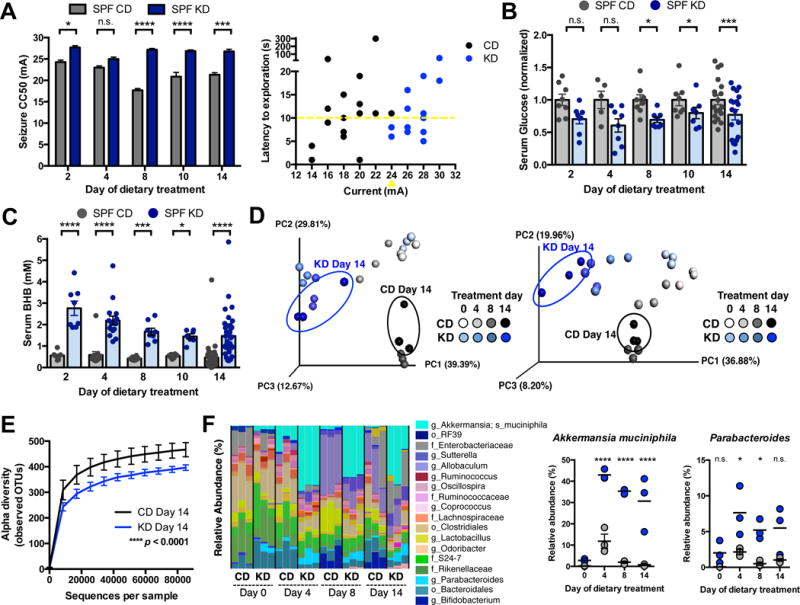
Figure 1. The Ketogenic Diet Alters the Gut Microbiota and Protects Against 6-Hz Psychomotor Seizures.

(A) Seizure thresholds in response to 6-Hz stimulation in independent cohorts of mice fed the CD or KD for 2, 4, 8, 10 or 14 days (left). n = 8, 6, 9, 20, 6 (CD); 8, 7, 12, 21, 5 (KD). Behavior in representative cohort of seizure-tested mice at 14 days post dietary treatment (right). Yellow line at y=10 seconds represents threshold for scoring seizures, and yellow triangle at 24 mA denotes starting current per experimental cohort. n = 16.
(B) Levels of serum glucose in mice fed CD or KD for 2, 4, 8, 10 or 14 days. Data are normalized to serum glucose levels seen in SPF CD mice for each time point. n = 8, 5, 8, 8, 19 (CD); 8, 8, 8, 7, 19 (KD).
(C) Levels of serum BHB mice fed CD or KD for 2, 4, 8, 10 or 14 days. n = 8, 13, 8, 8, 37 (CD); 8, 16, 8, 7, 38 (KD).
(D) Principal coordinates analysis of weighted (left) and unweighted (right) UniFrac distance based on 16S rDNA profiling of feces from mice fed CD or KD for 0, 4, 8 or 14 days. n = 3 cages/group.
(E) Alpha diversity of fecal 16S rDNA sequencing data from mice fed CD or KD for 14 days. n = 3 cages/group.
(F) Taxonomic distributions of bacteria from fecal 16S rDNA sequencing data (left). n = 3 cages/group. Relative abundances of Akkermansia muciniphila and Parabacteroides (right). n = 3 cages/group.
Data are presented as mean ± SEM. Two-way ANOVA with Bonferroni (A–C, E), Kruskal-Wallis with Bonferroni (F): *p < 0.05, **p < 0.01, ***p < 0.001, ****p < 0.0001. n.s.=not statistically significant. SPF=specific pathogen-free, CD=control diet, KD=ketogenic diet, CC50=current intensity producing seizures in 50% of mice tested, BHB=beta-hydroxybutyrate, OTUs=operational taxonomic units. See also Figure S1 and Tables S1 and S2.
