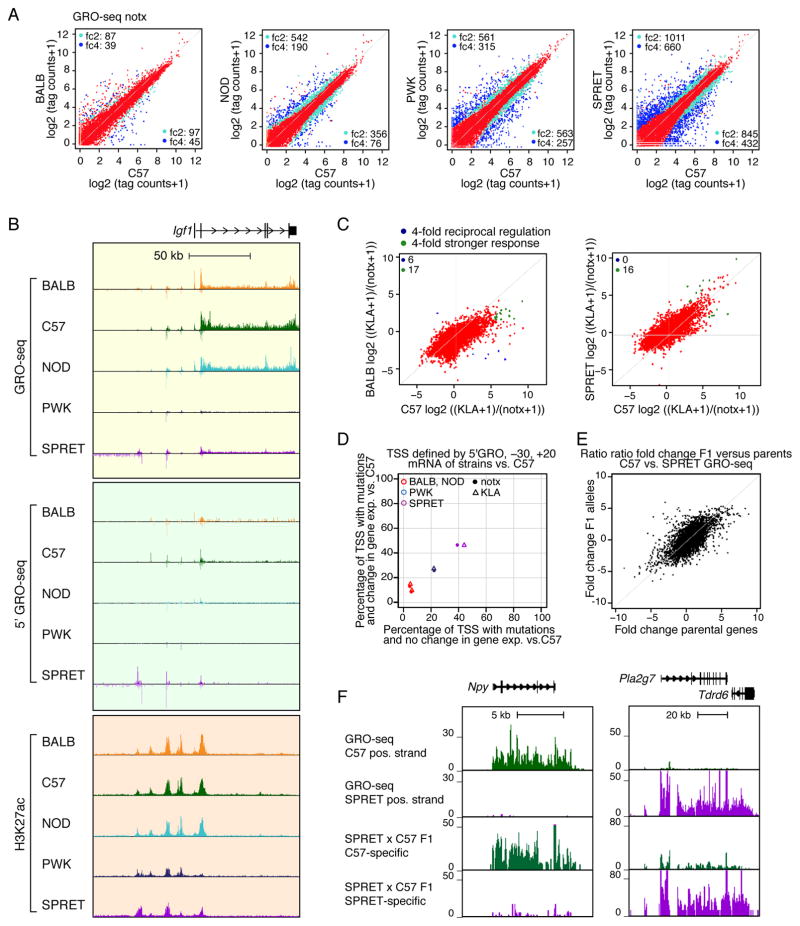
Figure 2. Effects of genetic variation on nascent transcription are primarily in cis at promoter-distal locations.
A. Comparison of GRO-seq gene body tag counts in BMDMs derived from the indicated mouse strains under notx. Log2(tag counts+1) values are plotted for BALB, NOD, PWK and SPRET vs. C57. Colors as in Figure 1A. B. Comparison of GRO-seq, 5′GRO-seq and H3K27ac signal at the Igf1 locus in BMDMs derived from each strain under notx conditions. C. Ratio-ratio plots of GRO-seq tag counts for KLA/notx conditions, comparing C57 vs. BALB or SPRET. Colors as in Figure 1D. D. Relationship of differential RNA-seq expression as a function of mutations between −30 and +20 bp of the TSS defined by 5′GRO-seq signal. E. Ratio-ratio plot of gene body GRO-seq tag counts in BMDMs derived from C57 and SPRET mice versus allele-specific tag counts in BMDMs derived from SPRET x C57 F1 mice. F. GRO-seq expression for Npy and Pla2g7 in BMDMs derived from C57 and SPRET mice and allele-specific tag counts in BMDMs derived from SPRET x C57 F1 mice.

