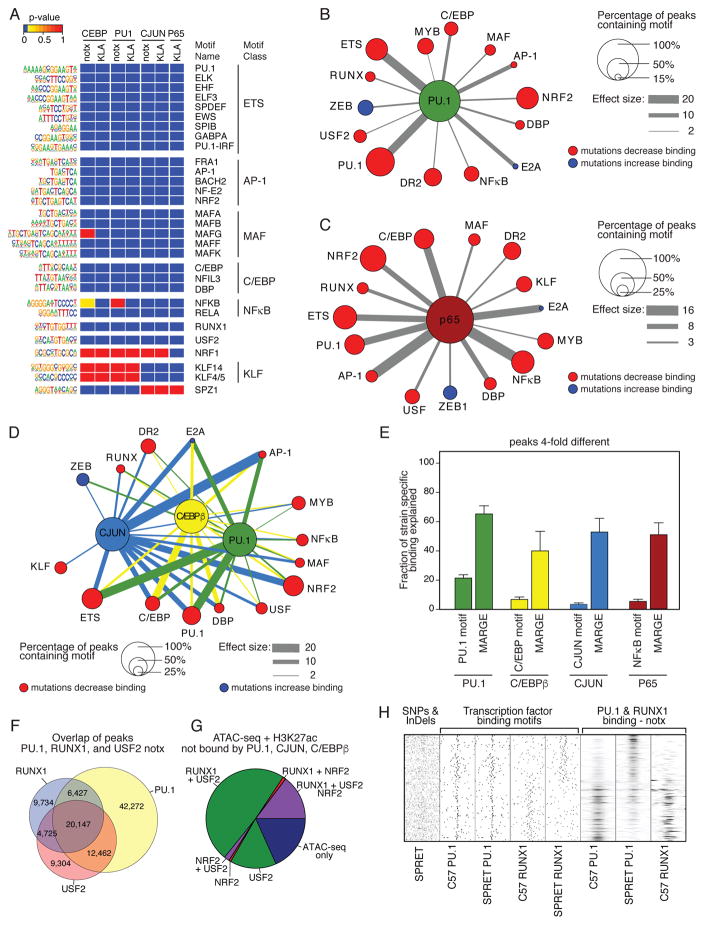
Figure 4. Effects of motif mutations enable inferences of a large network of collaborative TFs.
A. Heat map of a subset of significant motifs after application of MARGE under notx and KLA treatment conditions (complete listing in Table S4). B. Top 14 of 48 motifs correlated with binding of PU.1 under notx as determined by motif mutation analysis. For highly related motifs (e.g., ETS factor motifs), the motif with the largest effect size is illustrated. Node size is fraction of PU.1 peaks containing the indicated motif and edge thickness is proportional to the effect size of motif mutations. Nodes indicate motifs in which mutations result in reduced PU.1 binding (red) or in which mutations result in increased PU.1 binding (blue). C. Top 15 out of 60 motifs correlated with binding of P65 under KLA treatment as determined by MARGE. Node size and edge thickness are defined in Panel B. D. Integrated network of collaborative TFs. The top 15 of 80 motifs for which motif mutations affected binding of at least one of the three factors are shown. Node sizes are the average fractional overlap of the indicated motif with PU.1, C/EBPβ or CJUN peaks and edges are factor-specific effect sizes. E. Fraction of >4-fold different strain specific binding of TFs explained by mutations in their respective recognition motifs and by all mutations considered by MARGE analysis. F. Overlap of binding of PU.1, RUNX1 and USF2 under notx as determined by ChIP-seq for each factor. G. Fraction of open chromatin marked by H3K27ac and not bound by PU.1, CJUN or C/EBP occupied by RUNX1, USF2 and/or NRF2. H. Relationship of mutations in RUNX motifs on binding of RUNX1 and PU.1 in C57 and SPRET BMDMs.

