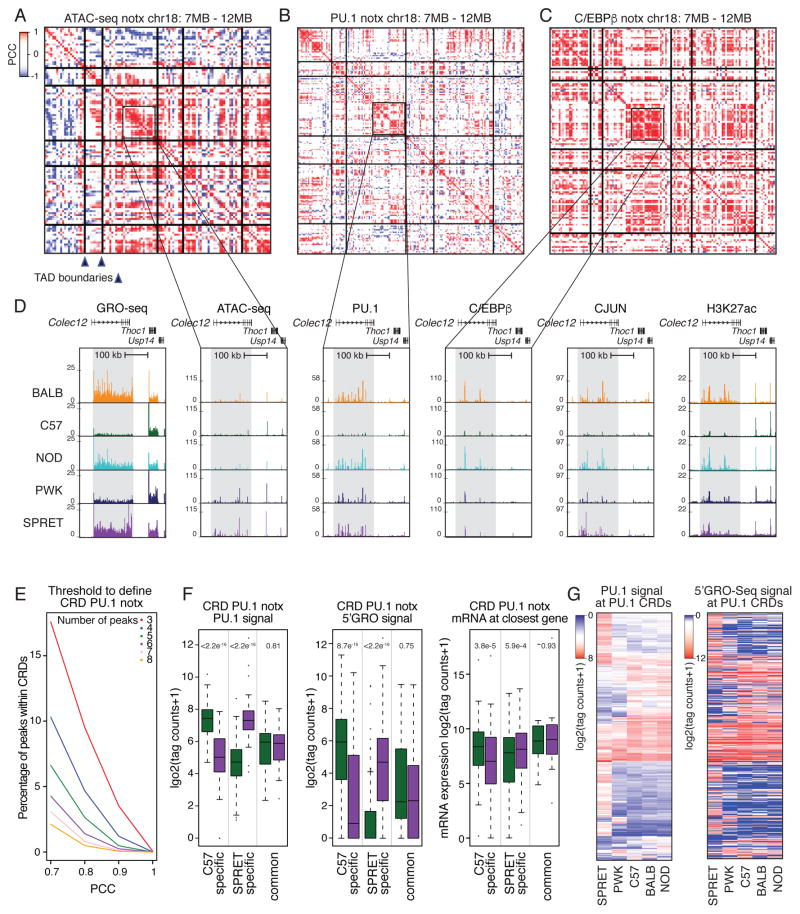
Figure 5. Clusters of ATAC-seq and ChIP-seq peaks are locally correlated.
A–C. Heat maps of Pearson correlation coefficients (PCC) of PU.1, C/EBPβ and CJUN peaks, respectively, across the five strains under notx conditions in a 5 MB window from chromosome 18. Vertical and horizontal lines represent TAD boundaries as defined by C57 Hi-C assays presented in Figure 6. Axes represent sequential locations associated with the indicated feature, with the matrix values corresponding to correlation coefficients defined by the accompanying scale. D. Regional correlation of GRO-seq, ATAC-seq, PU.1, C/EBPβ, CJUN, and H3K27ac signal in the vicinity of the Colec12 gene. E. % of PU.1 CRDs based on minimum peak number and minimum PCC. F. Relationship of strain-specific PU.1 CRDs to enhancer activity measured by 5′GRO-seq and expression of nearest expressed gene measured by RNA-seq (> 16 tag counts). Significance was calculated using a two-sided t-test. G. Heat maps for relative binding and 5′GRO-seq signal at PU.1 CRDs. The ordering of PU.1 signal and corresponding 5′GRO-seq signal is the same for the two plots.

