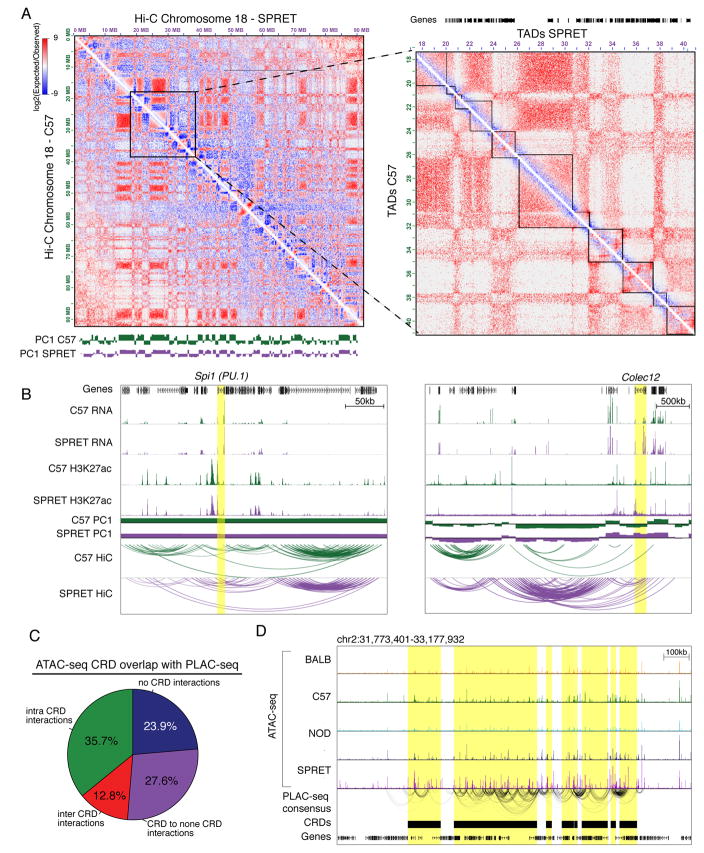
Figure 6. Correlated genomic features are highly connected as determined by proximity ligation assays.
A. Hi-C contact frequency maps for chromosome 18 in BMDMs derived from C57 and SPRET mice. The values for the PC1 eigenvector are shown at the bottom (left) with zoomed-in view visualizing TAD boundaries (right). B. RNA-seq, H3K27ac, PC1, and Hi-C contact loops in the vicinity of the Spi1 and Colec12 loci. C Fraction of significant consensus PLAC-seq interactions within, between and outside of ATAC-seq CRDs. D. Example of ATAC-seq notx CRDs highly connected by PLAC-seq consensus interactions.

