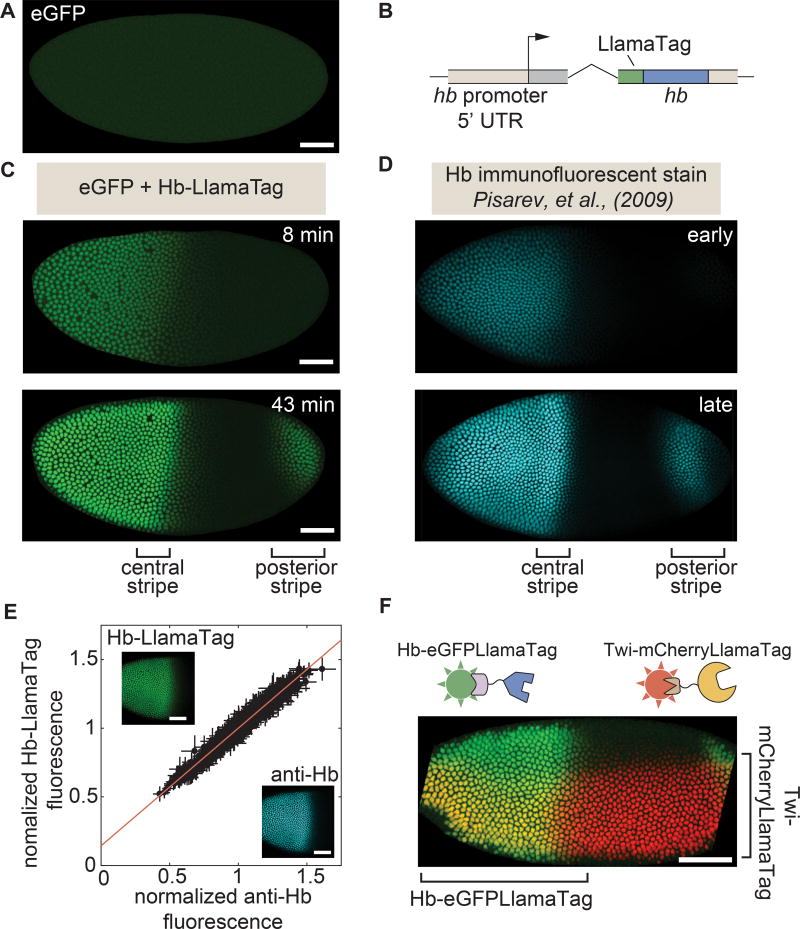
Figure 2. LlamaTags capture endogenous protein dynamics in the early embryo.
(A) In the absence of a LlamaTagged transcription factor, eGFP is uniformly distributed throughout the embryo. (B) CRISPR-mediated fusion of hb to a LlamaTag. (C,D) Hb-LlamaTag expression patterns recapitulate previous measurements obtained using fluorescent antibody staining: the early step-like Hb pattern (8 min into nc14) later forms two stripes of high protein concentration at 43 min into nc14, one in the middle of the embryo and one in its posterior. (E) Hb-LlamaTag eGFP signal per nucleus scales linearly with Hb fluorescence obtained by immunostaining. Data are normalized by their means. Error bars represent standard error over pixels within each nucleus. Inset, images of a fixed embryo in the GFP and anti-Hb channels that were used in generating the graph. See STAR Methods for further details. (F) Simultaneous visualization of Hb and Twi in an embryo initiating gastrulation using LlamaTags specific to eGFP and mCherry, respectively. Sharp edges on anterior and posterior of embryo are due to the embryo being larger than the field of view. All embryos are oriented with anterior to the left and ventral on the bottom. All scale bars are 50 µm. D, images taken from FlyEx database, see Pisarev et al. (2009). See also Figure S1–S4 and Movie S1.

